Chair:
Ross E. Leckie
Additional Members:Steven J. Corning, Dana L. Crandall, David L. Jahnke, Dennis L. Johnson, James R. Scott, Jr.
Meetings Held in 2018: 5
Independence:Mr. Leckie, Mr. Corning, Ms. Crandall, Mr. Jahnke, and Mr. Johnson are independent under applicable NASDAQ Marketplace Rules
The Risk Committee assists the Board in fulfilling its risk oversight responsibilities. Additionally, the Risk Committee oversees the Company’s enterprise-wide risk management program and corporate risk function, which include the strategies, policies, and systems established by senior management to identify, assess, measure, monitor, and manage the Company’s significant risks. The Risk Committee assesses whether management’s implementation of the program is further capable of managing those risks consistent with the Company’s risk appetite, monitoring whether the Company’s most significant enterprise-wide risk exposures are in alignment with the Company’s appetite for risk, and coordinating with and serving as a resource to the Board of Directors and other Board committees through facilitation of the understanding of enterprise-wide risk management processes and effectiveness. Each serving committee member attended at least 75% of the meetings during the period of the director’s membership, with the exception of Steven J. Corning who was unable to attend two of the meetings because they conflicted with another committee meeting he attended.
| | | | | | | | |
| Technology Committee |
Chair: Joyce A. Phillips* | Additional Members: James P. Brannen, Alice S. Cho, Thomas E. Henning, Dennis L. Johnson, and Jonathan R. Scott | Independence: Each member of this committee is independent under applicable NASDAQ Marketplace Rules |
Meetings Held in 2021:4 |
| *Ms. Phillips was appointed Chair in August 2021. Prior to Ms. Phillips’ appointment, Dana L. Crandall had served in the Chair role since May 2016. |
| Key Committee Responsibilities: | | |
Technology •CommitteeAssists the Board by providing oversight of our technology initiatives to allow the Company to meet its strategic objectives.
|
•Assesses and monitors technology, information, and cybersecurity risks; monitors technology and industry trends; and evaluates management’s assessment of their effects on our strategy and their implications for long-range planning. |
•Oversees the Company’s technology risks and provides updates to the Board, with assistance from the Risk Committee. |
Chair:Dana L. Crandall
Additional Members(1):Charles E. Hart, M.D., James R. Scott, Peter I. Wold, and Jonathan R. Scott(2)
Meetings Held in 2018: 4
Independence:Ms. Crandall, Mr. Hart, and Mr. Wold are independent under applicable NASDAQ Marketplace Rules
The Technology Committee assists the Board by ensuring we have the necessary technology and architecture to allow the Company to meet its strategic objectives. The Technology Committee also assesses and monitors technology, information and cybersecurity risks, monitors technology and industry trends, and evaluates management’s assessment of their effects on our strategy and their implications for long-range planning. Each serving committee member attended at least 75% of the meetings during the period of the director’s membership, with the exception of Peter I. Wold, who was unable to attend one of the two meetings held while he was a member.
(1) Our former director, Mr. Williams, served on this committee in 2018 until his resignation from the Board effective March 22, 2018.
(2)Mr. Scott’s service on this committee will cease at the time of our annual meeting of the shareholders.
|
|
| Board’s Role in Risk Oversight |
It is the responsibility of the Chief Executive Officer to fulfill the Board’s expectation of a strong risk management culture throughout the organization. It is the responsibility of the Chief Risk Officer to ensure an appropriate risk management framework is implemented to identify, assess, and manage our exposure to risk. The Board and its committees play an important role in overseeing executive management’s performance of their responsibilities relating to risk management. In general, this oversight includes working with executive management to determine an appropriate risk management culture, monitoring the amounts and types of risk taken in executing our business strategy, and evaluating the effectiveness of risk management processes against the policies and procedures established to control those risks. We have adopted a risk management oversight structure designed to ensure that all significant risks are actively monitored by the entire Board or one of its committees. Furthermore, given the importancesignificance of the Bank’s operations to us, additional risk management oversight is provided by the Bank’s boardBoard of directors, members of which include certain of our directors.Directors.
In most cases, our respective Board committees are responsible for the oversight of specific risks as outlined in each of their respective charters. For example, in addition to its oversight of all aspects of our annual independent audit and the preparation of our financial statements, the Audit Committee has been delegated responsibility for oversight of risks associated with our internal controls, monitoringreviewing and discussing processes in place to promote and monitor compliance with the implementationCode of our code of conduct,Conduct established by the Board, and overseeing responses to reports of examination. The Compensation and Human Capital Committee has been delegated responsibility for oversight of our compensation programs, including evaluating whether any of these programs contain features that promote excessive risk-taking by management and other employees, either individually or as a group. The Executive Committee oversees our capital positions and capital management activities to ensure compliance with applicable regulatory requirements and to ensure that our capital levels are a source of financial strength. The Governance &and Nominating Committee has been delegated responsibility for establishing and reviewing the adequacy of our codeCode of conduct;Conduct; reviewing and approving related party transactions; developing criteria and qualifications for Board membership; considering, recommending, and recruiting candidates to fill new or vacant positions on the Board; providing primary oversight of our Environmental, Social, and Governance ("ESG") program; and ensuring an effective and efficient system of governance is in place. The Risk Committee further assists the Board in fulfilling its risk oversight responsibilities by monitoring whether itsour risk governance processes are adequate, our enterprise-wide risk monitoring activities are appropriate, and theour enterprise-wide risk program is effective.The Risk Committee also provides oversight forof compliance, credit, liquidity, and market risk. The Technology Committee has been delegated responsibility for ensuring adequate processes are in place to protect our data. The committee chairs meet bi-annually to review each committee’s responsibilities for the oversight of specifictechnology, information, and cybersecurity risks.
They also provide oversight regarding technology and industry trends that influence strategic impacts on business risks.
In addition to oversight of risk management by the Board and its committees, the Bank’s boardBoard of directorsDirectors and its committees have been delegated the responsibility for overseeing management of the Bank’s lending activities, liquidity and capital position, asset quality, interest rate risk, and investment strategies. The chairmanchair of the Bank’s boardBoard of Directors communicates relevant information with respect to these activities to the Company's full Board.
The Board’s committees carry out their responsibilities by requesting and obtaining reports and other information from management with respect to relevant risk areas. In addition to our committee structure, our entire Board periodically receives reports and information about key risks and enterprise risk management from the chief risk officer.Chief Risk Officer.
Information Security/Cybersecurity
The Company is committed to protecting client information, and our Board of Directors and Chief Information Officer devote significant time to mitigating cybersecurity risks. The Board is responsible for overseeing the Company’s risk. The Technology Committee is responsible for overseeing the Company’s technology risks, including information security and cybersecurity risk. The Chair of the Technology Committee provides updates to the Board.
Shareholder Communications with the Board
We have not, to date, developed a formal process for shareholder communications with the Board. We believe our current informal process, in which any communication sent to the Board either generally or in care of the Chief Executive Officer, Corporate Secretary, or other corporate officer or director is forwarded to all members of the Board, has adequately served the Board’s and the shareholders’ needs.
Environmental, Social, and Governance Oversight
The Governance and Nominating Committee of the Board has primary oversight of our efforts to be responsible stewards of the environment, to be a good corporate citizen in our communities, and to maintain strong governance practices. In addition, the Compensation and Human Capital Committee has oversight of various social efforts relating to that committee’s responsibilities, such as employee benefits, employee engagement, and Company culture.
This oversight helps us focus better on how we impact our key stakeholders and communities, while also strengthening our business performance.
We are focused on responsible and sustainable growth and environmental, social, and governance leadership. Additional information concerning our environmental, social, and governance efforts can be found on the Company’s website at www.FIBK.com by selecting “ESG.” The information contained on our website with respect to our environmental, social, and governance efforts and our Environmental, Social, and Governance Report that can be reviewed there shall not be deemed to be a part of, or incorporated by reference in, this proxy statement for any purpose.
Financial Code of Ethics
Our Chief Executive Officer, Chief Financial Officer, and Principal Accounting Officer or other persons performing similar functions are required to comply with our Financial Code of Ethics.
The purposes of the Financial Code of Ethics are as follows:
▪to deter wrongdoing and to promote, among other things, honest and ethical conduct;
▪to promote full, fair, accurate, timely, and understandable disclosure in SEC and public filings;
▪to promote compliance with applicable laws, rules, and regulations;
▪to facilitate prompt internal reporting of violations of the Financial Code of Ethics; and
▪to provide accountability for adherence to such code.
Employees may submit concerns or complaints regarding ethical issues on a confidential basis by means of a toll-free telephone hotline or the use of an internet-based reporting system. All concerns and complaints are reported to our Chief Audit Executive, General Counsel, Chief Risk Officer, and Financial Crimes Manager, among others. Investigations are monitored by the Chief Audit Executive who is responsible for reporting relevant complaints to the Audit Committee. A current copy of our Financial Code of Ethics is incorporated by reference as Exhibit 14.1 to the Company’s Annual Report on Form 10-K filed with the SEC for the year ended December 31, 2021. There were no amendments to or waivers from compliance with our Financial Code of Ethics in 2021, and we intend to disclose any amendments to or waivers from our Financial Code of Ethics on our website at www.FIBK.com.
|
|
Proposal Three Ratification of Appointment of Independent Registered Public Accounting Firm RSM US LLP was appointed by the Audit Committee of the Board as our independent registered public accounting firm for the year ending December 31, 2022. While the Audit Committee is directly responsible for the appointment, compensation, retention, and oversight of our independent registered public accounting firm, the Audit Committee has requested that the Board submit the selection of RSM US LLP to our shareholders for ratification as a matter of good corporate governance. No representatives of RSM US LLP are expected to be present at the annual meeting. Neither the Audit Committee nor the Board is required to take any action as a result of the outcome of the vote on this proposal. If our shareholders do not ratify the selection of RSM US LLP as our independent registered public accounting firm, however, the Audit Committee will consider whether to retain RSM US LLP or to select another independent registered public accounting firm. Furthermore, even if the selection is ratified, the Audit Committee in its discretion may appoint a different independent registered public accounting firm at any time during the year if it determines that such a change is in the best interest of the Company and our shareholders. If a quorum is present at the annual meeting, the affirmative vote of a majority of the voting power of the shares of common stock present in person or represented by proxy at the annual meeting and entitled to vote on this proposal is required to ratify the appointment of the independent registered public accounting firm. This means that the appointment of RSM US LLP as the independent registered public accounting firm for the Company will be ratified if more than 50% of the votes present in person or represented by proxy and entitled to vote on the proposal at the annual meeting are cast by shareholders in favor of ratification. The persons named as proxies in the proxy card accompanying these materials will vote the shares represented by a validly executed proxy card for the ratification of the selection of the independent registered public accounting firm unless a vote against the proposal or an abstention is specifically indicated on the proxy card in respect of this proposal.

Audit Committee Pre-Approval Policies and Procedures |
The Audit Committee charter requires advance approval of all audit and non-audit services performed by the independent registered public accounting firm to assure that such services do not impair the auditor’s independence from the Company. The Audit Committee may delegate the authority to pre-approve services to the Audit Committee chair or any two other members of the Audit Committee, subject to ratification by the Audit Committee at its next committee meeting. In 20182020 and 2017,2021, all of the fees paid to our independent auditor were approved in advance by the Audit Committee.
|
|
| Principal Accounting Fees and Services |
RSM US LLP has been the Company’s independent registered public accounting firm since 2004. RSM US LLP was paid the following fees for services performed during the fiscal years ended December 31, 20182021 and 2017:2020:
|
| | | | | | | | | |
| | | | 2018 | | 2017 |
Audit fees(1) | | $ | 912,100 |
| | $ | 1,040,000 |
|
Audit-related fees(2) | | 36,510 |
| | 19,580 |
|
| Tax fees | | — |
| | — |
|
| All other fees | | — |
| | — |
|
| | | | | | | | | | | | | | | | | |
| | | 2021 | | 2020 |
Audit fees (1) | | $ | 1,018,000 | | | $ | 1,005,000 | |
Audit-related fees (2) | | 105,700 | | | 75,000 | |
| Tax fees | | — | | | — | |
All other fees (3) | | 34,125 | | | — | |
|
| | | | |
| (1) | Audit fees consist of fees for the audit of the financial statements included in our Annual Report on Form 10-K and reviews of the Quarterly Reports on Form 10-Q, including procedures related to acquisitions, the costs with respect to which were higher in 2017 and represent the majority of the difference between periods. |
| acquisitions. |
| (2) | Audit-related fees for 2018 consist of fees for review of our registration statements on Form S-4 filed with the SEC on June 8, 2018 and November 28, 2018 and our Form S-4/A filed with the SEC on July 2, 2018. Audit-related fees for 20172021 consist of fees for review of our registration statement on Form S-4 filed with SEC on November 4, 2021 and our Form S-4/A filed with the SEC on April 6, 2017 andDecember 14, 2021. Audit-related fees for 2020 consist of fees for review of our registration statement on Form S-3 filed with the SEC on September 25, 2017.March 16, 2020, in addition to the issuance of Comfort Letters and Consents in conjunction with the May 2020 subordinated debt offering. |
| (3) | Includes non-prohibited services provided by our principal accountant not applicable to the first two categories. |
The Audit Committee of the Board of Directors is currently composed of six independent directors and operates under a charter approved by the Board of Directors. The SEC and the NASDAQ stock market have established standards relating to Audit Committee membership and functions. With regard to such membership standards, the Board has determined that David L. Jahnke,each of Ross E. Leckie, Stephen B. Bowman, Alice S. Cho, Frances P. Grieb, and Dennis L. Johnson and Ross E. Leckie meet the requirements of an “audit committee financial expert” as defined by the SEC and each of the Audit Committee members have the requisite financial literacy and accounting or related financial management expertise required generally of an Audit Committee member under the applicable standards of the SEC and NASDAQ.
The primary duties and responsibilities of the Audit Committee are to monitor: (i) the quality and integrity of the financial statements and related internal controls; (ii) the internal audit and independent registered public accounting firm’s qualifications and independence; (iii) the performance of the Company’s internal audit function and independent auditors; and (iv) compliance by the Company with legal and regulatory requirements. While the Audit Committee has the duties and responsibilities set forth above and those set forth in its charter: management is responsible for the internal controls and the financial reporting process; the Company’s internal auditors are responsible for preparing an annual audit plan and conducting internal audits under the control of the Chief Audit Executive, who is accountable to the Audit Committee; and the independent registered public accounting firm is responsible for performing an integrated audit of our financial statements and of the effectiveness of our internal control over financial reporting in accordance with standards established by the Public Company Accounting Oversight Board (PCAOB) and issuing a report thereon.
The Audit Committee relies, without independent verification, on the information provided to it and on the representations made by management regarding the effectiveness of internal control over financial reporting, and that such financial statements have been prepared in conformity with accounting principles generally accepted in the United States of America. The Audit Committee also relies on the opinions of the independent auditors on the consolidated financial statements and on the effectiveness of internal control over financial reporting. The Audit Committee’s oversight does not provide assurance that management’s and the auditor’s opinions and representations are correct.
In the performance of its oversight function, the Audit Committee has performed the duties required by its charter, including meeting and holding discussions with management, the independent registered public accounting firm and internal audit, and has reviewed and discussed the audited consolidated financial statements for the year ended December 31, 20182021, with management and the independent registered public accounting firm. The Audit Committee’s review of and discussions about the financial statements included discussions about the quality, not just the acceptability, of the accounting principles used, the reasonableness of significant judgments, and the clarity of disclosures in the financial statements.
The Audit Committee also discussed with the independent auditors all matters required to be discussed by the applicable standards issued by the Public Company Accounting Oversight BoardPCAOB and has received the written disclosures and the letter from the independent auditors required by the applicable requirements of the Public Company Accounting Oversight BoardPCAOB regarding the independent auditors’ communications with the Audit Committee concerning independence. The Audit Committee discussed with the independent auditors their independence and any relationships that might have an impact on their objectivity and independence and reviewed and approved the amount of fees paid for audit and audit-related services.
Based upon a review of the reports and discussions with management, the independent registered public accounting firm, and the Audit Committee’s review of the representations of management and the Report of Independent Registered Public Accounting Firm, subject to the limitations on its role and responsibilities described above and in the Audit Committee charter, the Audit Committee recommended to the Board of Directors that the audited financial statements referred to above be included in ourthe Company’s Annual Report on Form 10-K for the year ended December 31, 2018 for filing2021 as filed with the SEC.
The Audit Committee is directly responsible for the appointment, compensation, retention, and oversight of the independent registered public accounting firm retained to audit the Company’s financial statements. RSM US LLP (RSM) has been retained as the Company’s independent registered public accounting firm continuously since they were appointed in fiscal year 2004. In determining whether to reappoint RSM, the Audit Committee takes into consideration various factors, including: the historical and recent performance of RSM on the audit; its professional qualifications; the quality of ongoing discussions with RSM; external data, including recent PCAOB reports on RSM; the appropriateness of fees and RSM’s tenure, including the benefits of that tenure, and the controls and processes in place (such as rotation of key partners every five years) that help ensure RSM’s continued independence in the face of such tenure. As part of the normal rotation, a new lead partner was selected for 2019. The process for selection of athe new lead engagement partner includesincluded meetings between the candidates for that role and senior management and the Chair of the Audit Committee, as well as discussion with the full Audit Committee. The Audit Committee has selected RSM to be the Company’s independent registered public accounting firm for fiscal 2019.year 2022.
Submitted by the Audit Committee of the Board of Directors:
|
| | | | | | | | | | | | | | | | |
David L. JahnkeRoss E. Leckie (Chair) | Dana L. CrandallStephen B. Bowman | Alice S. Cho | Frances P. Grieb | Dennis L. Johnson | |
Ross E. Leckie | Peter I. Wold | William B. Ebzery | Joyce A. Phillips |
|
|
Shareholder Communications with the Board |
We have not, to date, developed a formal process for shareholder communications with the Board. We believe our current informal process, in which any communication sent to the Board either generally or in careThe foregoing Report of the Chief Executive Officer, corporate secretary, or other corporate officer or director is forwarded to all members of the Board, has adequately served the Board’s and the shareholders’ needs.
|
|
Environmental, Social, and Governance Oversight |
The Governance & NominationsAudit Committee of the Board has primary oversight of our efforts to be responsible stewards of the environment, to be a good corporate citizen in our communities, and to maintain strong governance practices.
This oversight helps us focus better on how we impact our key stakeholders and communities, while also strengthening our business performance.
We are focused on responsible growth and environmental, social, and governance leadership. Additional information concerning our environmental, social, and governance efforts can be found on the Company’s website at www.FIBK.com by selecting “Environmental, Social, and Governance Report.” The information contained on our website with respect to our environmental, social, and governance efforts and our Environmental, Social, and Governance Report that can be reviewed there shall not be deemed under the Securities Act of 1933, as amended, or the Securities Exchange Act of 1934, as amended, to be a part of,(i) “soliciting material” or “filed” or (ii) incorporated by reference by any general statement into any filing made by us with the SEC, except to the extent that we specifically incorporate such report by reference.
Security Ownership of Certain Beneficial Owners and Management
The following table sets forth information regarding the beneficial ownership of our common stock as of March 25, 2022, for (i) each of our directors and director nominees, (ii) each of the executive officers named in this proxy statementthe summary compensation table, (iii) all directors and executive officers as a group, and beneficial owners of more than 5% of our common stock.
We have determined beneficial ownership in accordance with the rules of the SEC. Except as indicated by the footnotes below, we believe, based on the information furnished to us or disclosed in filings made with the SEC, that the persons and entities named in the table below have sole voting and investment power with respect to all shares of common stock that they beneficially own, subject to applicable community property laws.
The percentage of shares shown as beneficially owned as of March 25, 2022, is based on 109,503,410 shares of our Class A common stock outstanding. In computing the number of shares of common stock beneficially owned by a person and the percentage ownership of that person, we deemed shares of common stock subject to options and other derivative securities held by that person that were exercisable or vesting based only on the expiration of time on or within 60 days of March 25, 2022, to be outstanding. We did not deem these shares outstanding, however, for the purpose of computing the percentage ownership of any purpose.other person.
Unless otherwise noted below, the address for each director, director nominee, NEO, and beneficial owner of more than 5% of a class of our common stock listed in the table below is: c/o First Interstate BancSystem, Inc., 401 North 31st Street, Billings, MT 59101.
| | | | | | | | | | | | | | |
| Beneficial Ownership Table |
| | Class A Common Stock Beneficially Owned |
| Name of Beneficial Owner | | Number of Shares | | Percent of Class |
| | | | |
| Directors and nominees for director | | |
| David L. Jahnke | | 16,984 | | * |
| Kevin P. Riley | | 208,206 | | * |
| Stephen B. Bowman | | 2,003 | | * |
| James P. Brannen | | 16,109 | | * |
| Alice S. Cho | | 2,608 | | * |
| Frances P. Grieb | | 16,943 | | * |
| Thomas E. Henning | | 19,075 | | * |
John M. Heyneman, Jr.(1) | | 1,505,735 | | 1.4% |
| Dennis L. Johnson | | 6,271 | | * |
| Stephen M. Lacy | | 11,897 | | * |
| Ross E. Leckie | | 6,845 | | * |
| Patricia L. Moss | | 12,242 | | * |
| Joyce A. Phillips | | 1,415 | | * |
| Daniel A. Rykhus | | 17,069 | | * |
James R. Scott (2) | | 4,393,969 | | 4.0% |
Jonathan R. Scott (3) | | 535,156 | | * |
| | | | |
| Named Executive Officers who are not directors | | | | |
| Marcy D. Mutch | | 55,558 | | * |
| Jodi Delahunt Hubbell | | 37,534 | | * |
| Russell A. Lee | | 20,351 | | * |
| Kirk D. Jensen | | 24,756 | | * |
| | | | |
| All executive officers and directors as a group (22 persons) | | 6,949,059 | | 6.4% |
| | | | |
| 5% or greater security holders | | | | |
Scott Family FIBK Shareholder Group (4) | | 16,049,363 | | 14.7% |
| | | | |
| | | | |
| | | | |
| | | | |
| | | | |
| | | | |
| | | | |
| | | | |
| | | | |
| | | | |
| * Less than 1% of the class of Class A common stock outstanding. |
|
| | | | |
Financial Code(1) | Includes 257,508 shares over which Mr. Heyneman reports shared voting and dispositive power. Mr. Heyneman disclaims beneficial ownership, except to the extent of Ethicshis pecuniary interest therein, over 1,343,000 of the shares reported as beneficially owned indirectly by Mr. Heyneman, which shares are reported as indirectly beneficially owned, in the aggregate, through a limited partnership and several family trusts. Mr. Heyneman has caused a trust through which he reports indirect beneficial ownership in the shares to pledge as collateral security for a loan (line of credit) from Western Security Bank 11,700 shares of Class A common stock. |
| (2) | Includes 375,811 shares over which Mr. Scott reports shared voting and dispositive power. Mr. Scott has caused a trust through which he reports indirect beneficial ownership in the shares to pledge as collateral security for a loan from Western Security Bank 395,000 shares of Class A common stock. |
| (3) | Mr. Scott has caused a trust through which he reports indirect beneficial ownership in the shares to pledge as collateral security for a loan from Western Security Bank 380,000 shares of Class A common stock. |
| (4) | Based on an amendment to Schedule 13D filed with the SEC on March 31, 2022 (the “Schedule 13D/A”). As disclosed in the Schedule 13D/a, the Scott Family FIBK Shareholder Group is composed of John M. Heyneman, Jr., Susan Heyneman, Julie Scott Rose, Homer Scott, Jr., James R. Scott, James R. Scott, Jr., Jeremy P. Scott, Jonathan R. Scott, Risa K. Scott, and several trusts, foundations, entities and other shareholders of the Company affiliated with such Scott family members which are identified in the Schedule 13D/A and which signed with such family members a Stockholders’ Agreement with the Company dated September 15, 2021. The foregoing family members report sole or shared voting and dispositive power over all of such shares. |
Our Chief Executive Officer, Chief Financial Officer, and Principal Accounting Officers or other persons performing similar functions are required to comply with our code of ethics for our Chief Executive Officer and senior finance officers.
The purposes of the code of ethics are as follows:
to deter wrongdoing and to promote, among other things, honest and ethical conduct;
to promote full, fair, accurate, timely, and understandable disclosure in SEC and public filings;
to promote compliance with applicable laws, rules, and regulations;
to facilitate prompt internal reporting of violations of the financial code of ethics; and
to provide accountability for adherence to such code.
Employees may submit concerns or complaints regarding ethical issues on a confidential basis by means of a toll-free telephone hotline or the use of an internet-based reporting system. All concerns and complaints are reported to our Chief Audit Executive, General Counsel, Chief Risk Officer, and Financial Crimes Manager. Investigations are monitored by the Chief Audit Executive who is responsible for reporting complaints to the Audit Committee. A current copy of our financial code of ethics can be found in Exhibit 14.1 to the Company’s Annual Report on Form 10-K. There were no amendments to or waivers from our financial code of ethics in 2018, and we intend to disclose any future amendments to or waivers from our financial code of ethics on our website at www.FIBK.com.
|
|
COMPENSATION DISCUSSION AND ANALYSIS |
|
Compensation Discussion and Analysis
The compensation discussion and analysis (“CD&A”) describes our executive compensation program for the following 20182021. Our Named Executive Officers (“NEOs”) are our Chief Executive Officer, our Chief Financial Officer, and our three most highly compensated other executive officers collectively referred to aswho were serving in that capacity at the “Named Executive Officers”:end of the year 2021. Our NEOs for 2021 are listed below:
•Kevin P. Riley, President and Chief Executive Officer
•Marcy D. Mutch, Executive Vice President and Chief Financial Officer
•Jodi Delahunt Hubbell, Executive Vice President and Chief Operating Officer
•Russell A. Lee, Executive Vice President and Chief Banking Officer
•Kirk D. Jensen, Executive Vice President and General Counsel
Philip Gaglia, Executive Vice President2021 Performance Highlights
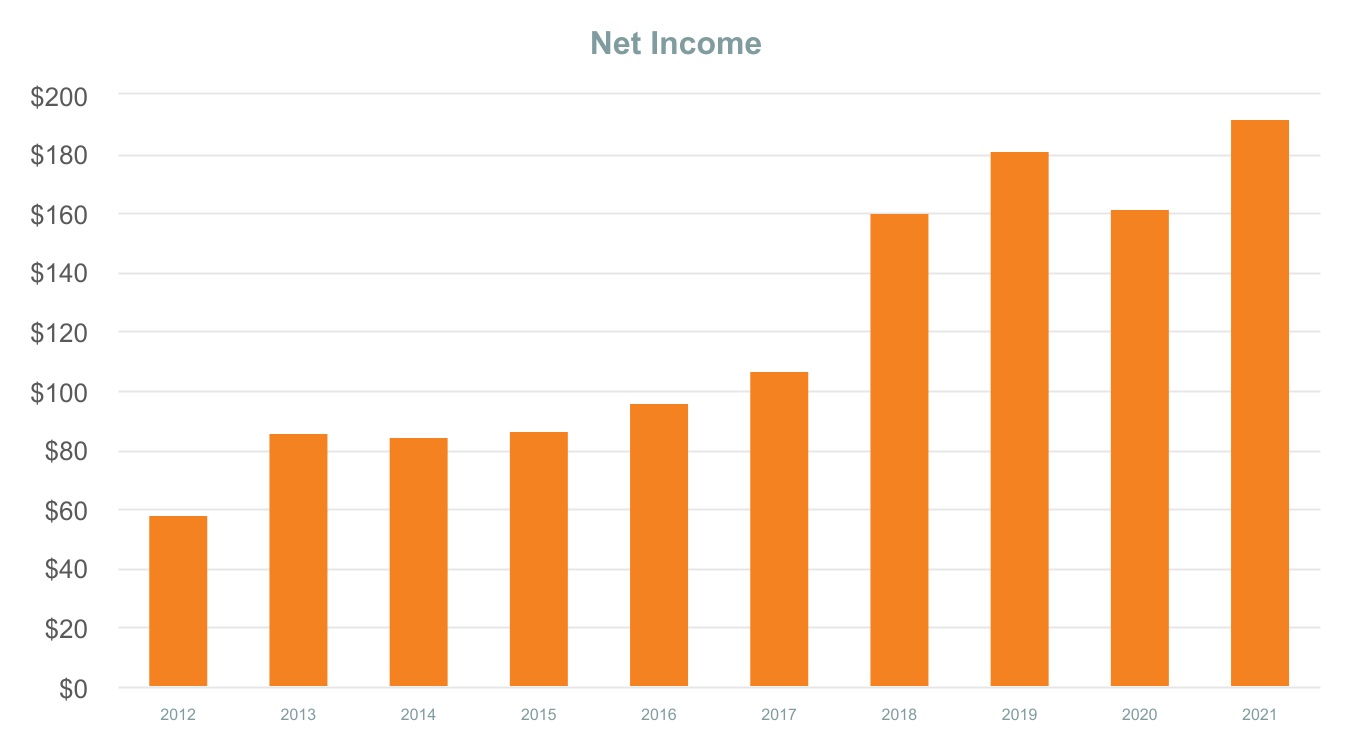
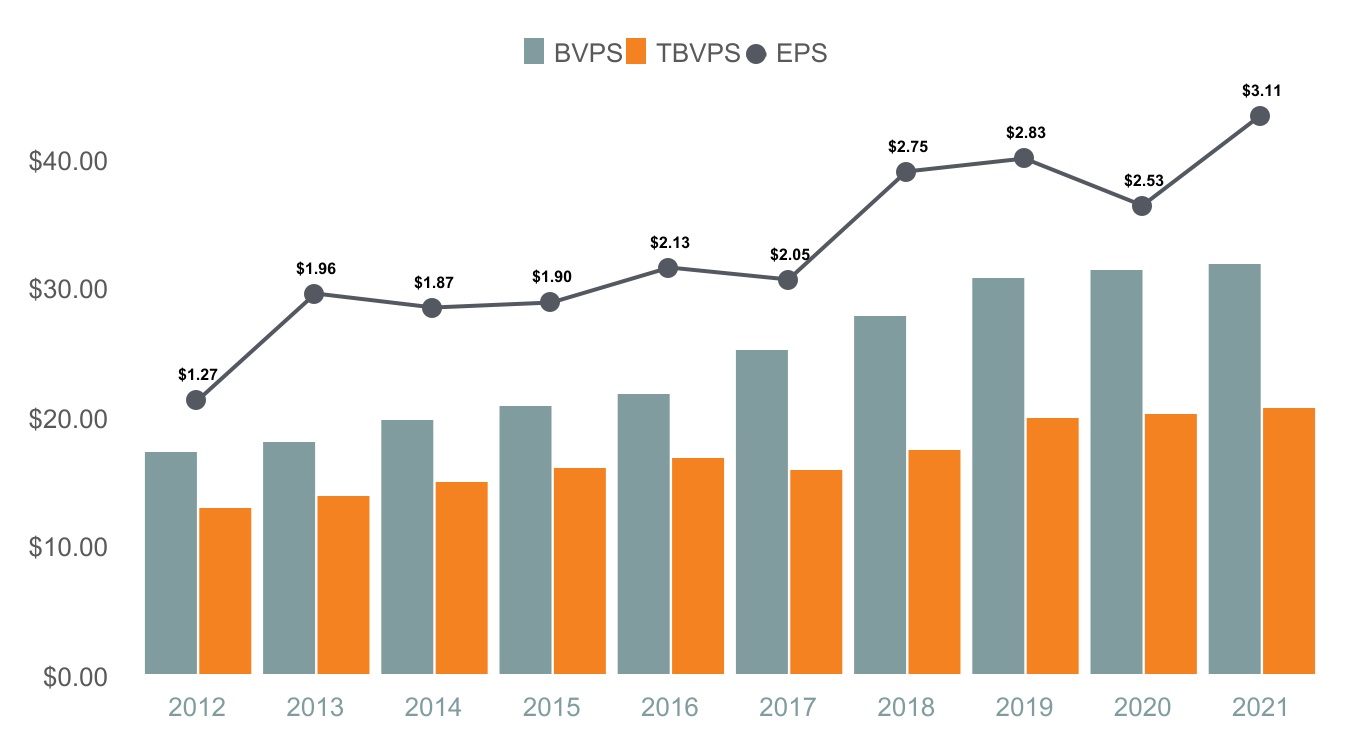
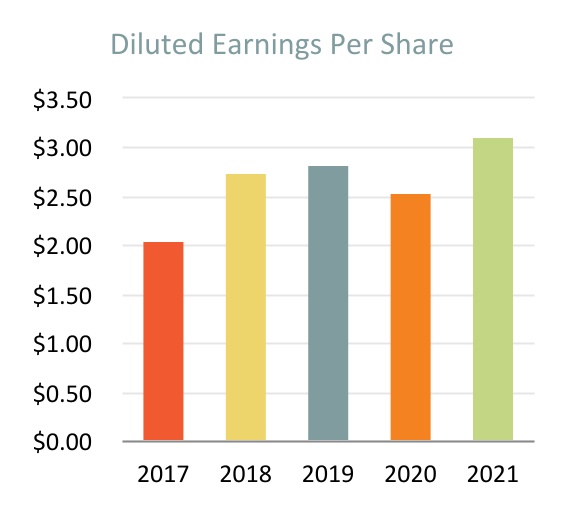
We produced strong results in 2021, with net income of $192.1 million, and Chief Risk Officerdiluted earnings per share of $3.11, resulting in year-over-year increases of 19% and 23%, respectively. Net income included acquisition costs of $11.6 million, which impacted earnings per share by $0.15.
William D. Gottwals, Executive Vice PresidentCredit quality was outstanding, with non-performing assets to total assets and Directorcriticized loans down 41% and 37%, respectively, from the prior year. Net charge-offs of Banking
Stephen W. Yose, Executive Vice President and Chief Credit Officer
Our performance for 2018 was highlighted by the successful acquisition$7.3 million were 7 basis points of Northwest Bancorporation, Inc., parent company of Inland Northwest Bank (“INB”) and the announcementtotal average loans, which allowed us to release reserves which had been elevated in 2020 as a result of the two pending acquisitions of Idaho Independent Bank and Community 1st Bank. The Northwest Bancorporation, Inc. acquisition was completed on August 16, 2018, and the Company merged INB with our existing bank subsidiary, First Interstate Bank, on November 9, 2018. This transaction expanded our presence in the high-growth markets in the Northwest.
During 2018, we reported earnings of $160.2 million, or $2.75 per diluted share. Earnings levels benefited from four months of INB earnings, improved credit quality, expanded net interest margin, and the impact of tax reform. Our reported return on average common equity was 10.50% and our return on average assets was 1.27%.
Exclusive of acquisition-related expenses and net investment securities gains (losses), our 2018 earnings would have increased 31.3% over our similarly calculated 2017 earnings.
pandemic.
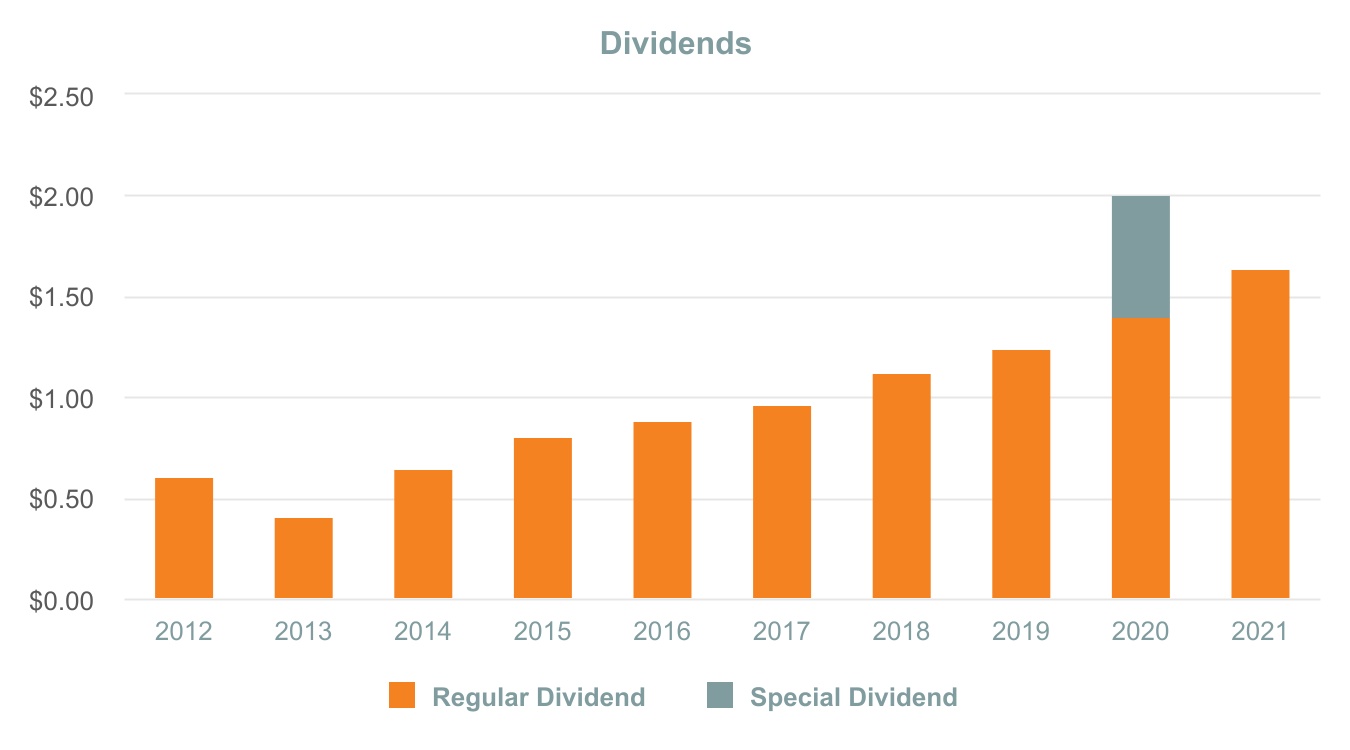
We have paid over 24 yearsdividends of consecutive quarterly dividends. During 2018, we increased quarterly dividends by 16.7% to $0.28$1.64 per common share, and we recently announced a 10.7% increase in quarterly dividends to $0.31 per common share for the first quarter of 2019, which equates to an annualized yield of 2.98%3.76% based on the $41.55$43.61 per share average closing price of our common stock duringfor 2021.
Impacts from the fourth quarter of 2018.
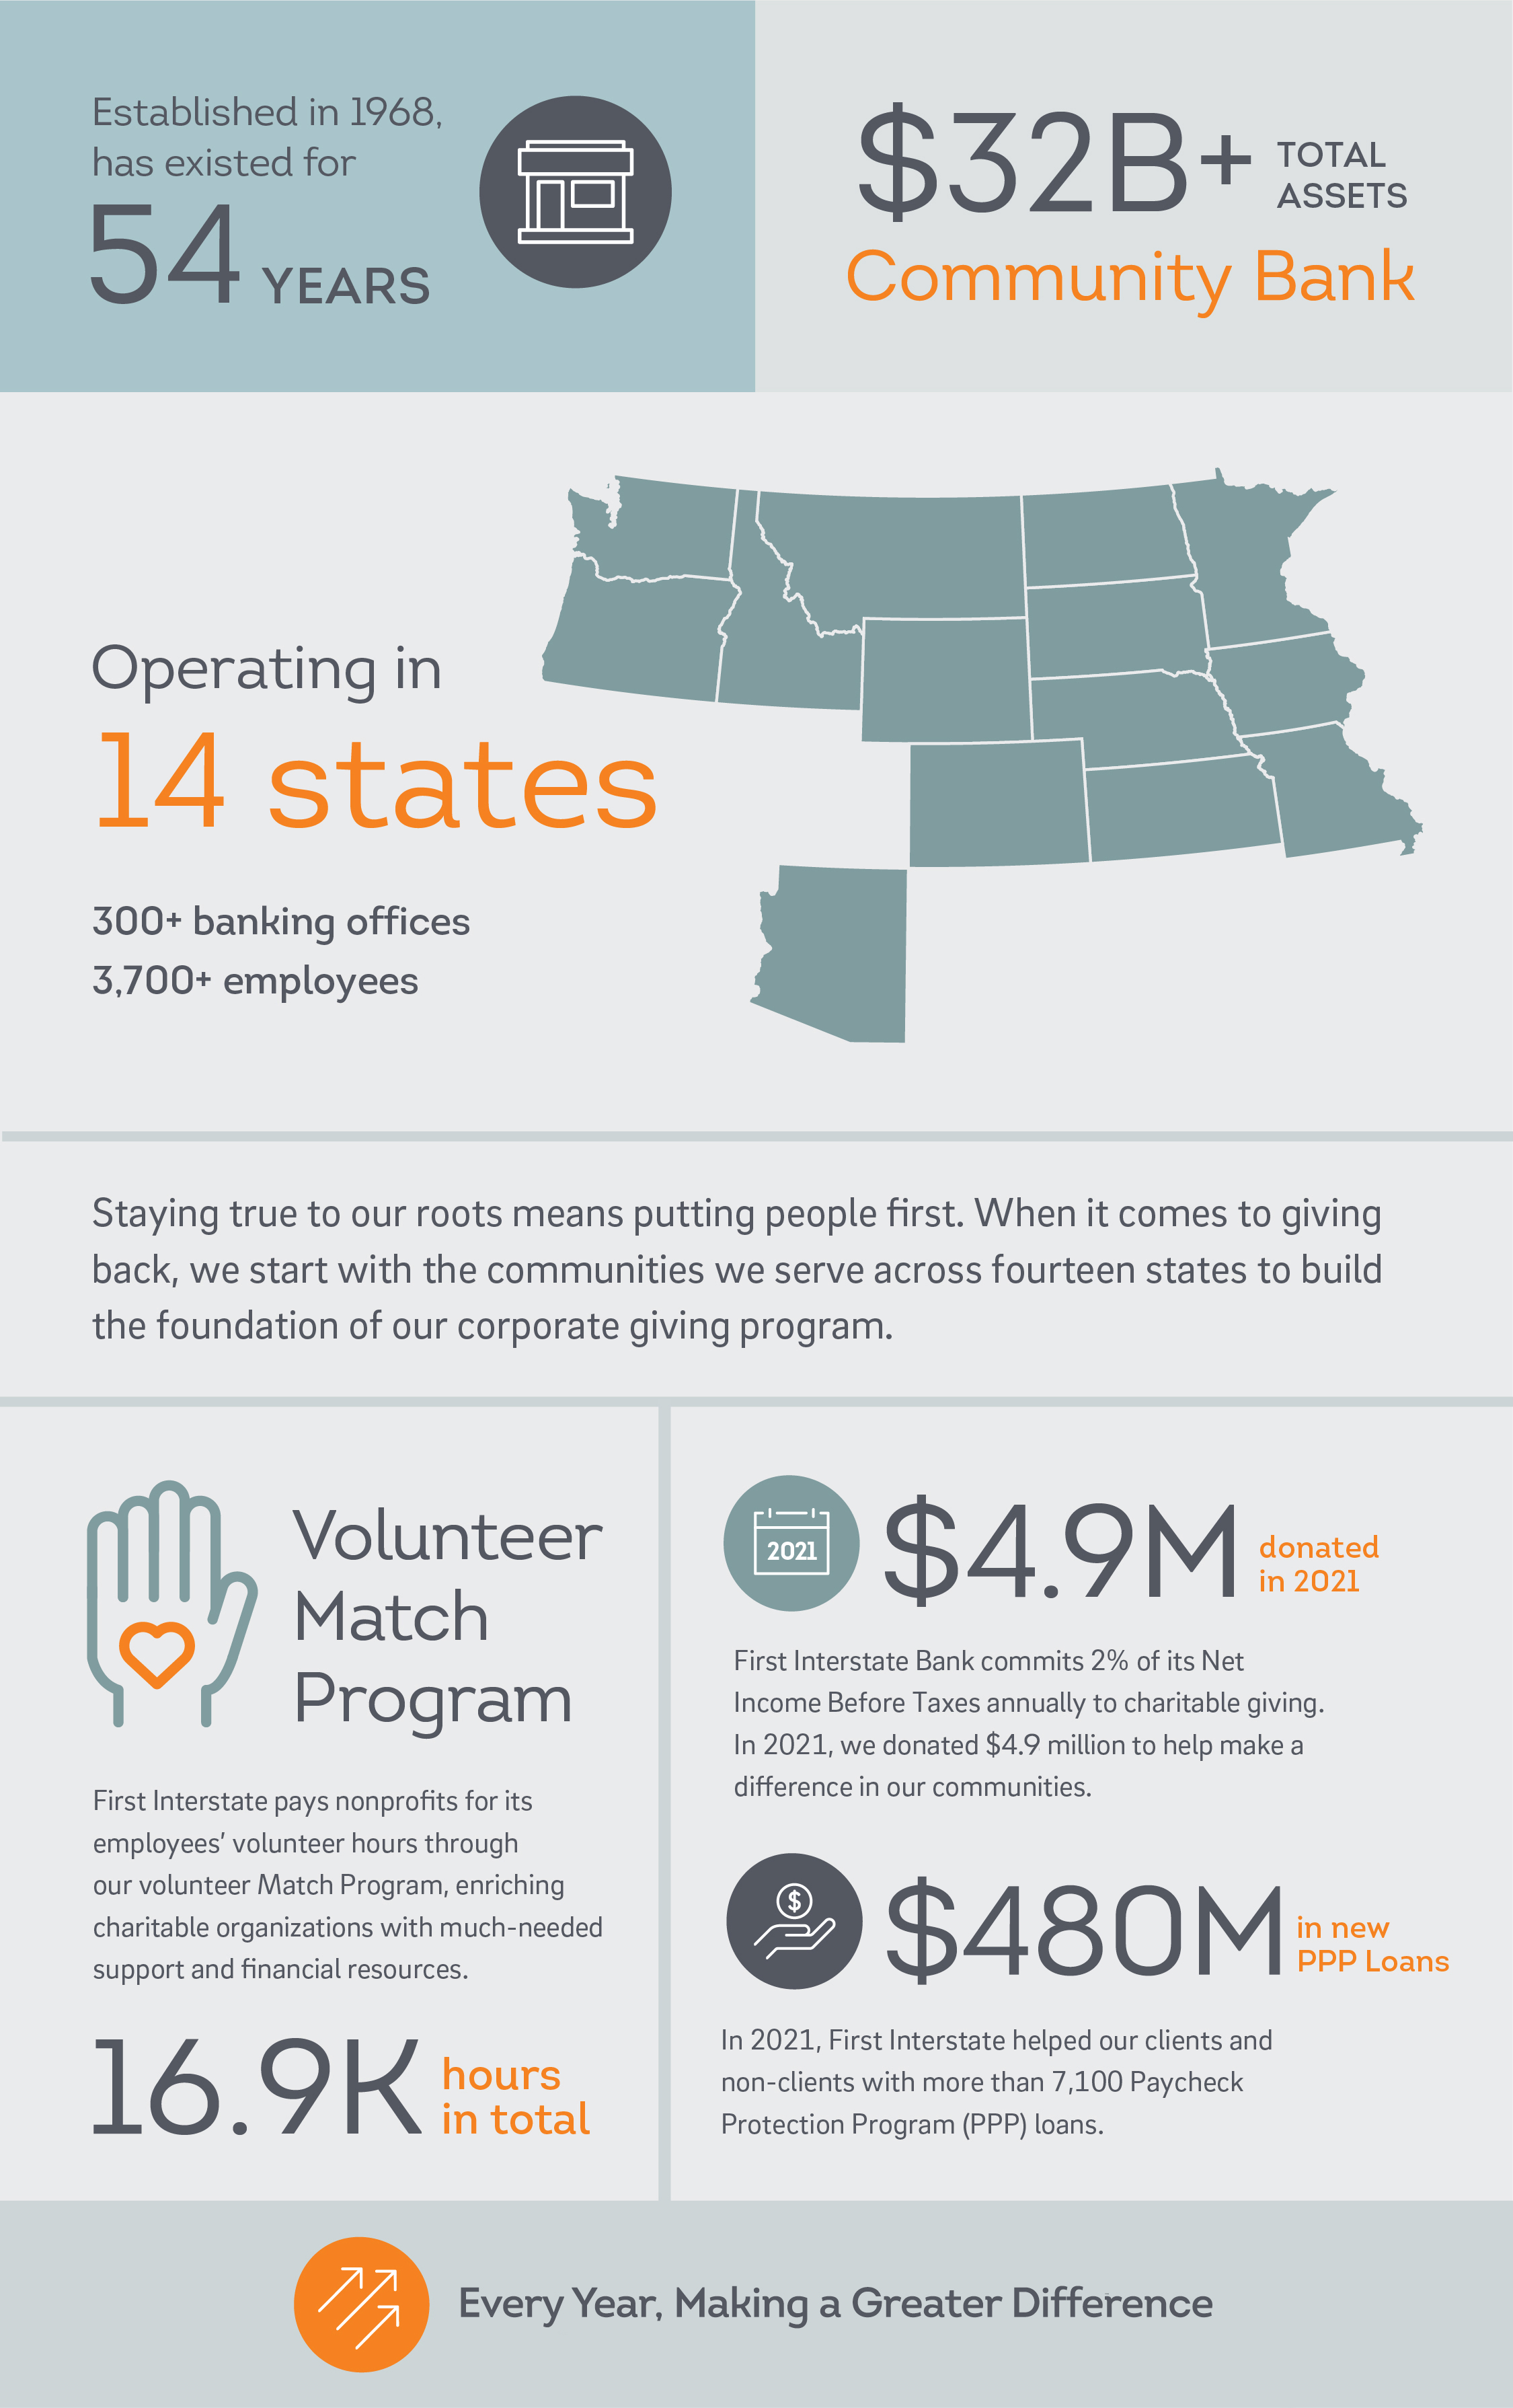
We remained focused on people, processes, and technology throughout 2018.global pandemic continued to impact 2021. We continued to investprovide our clients and non-clients access to the Paycheck Protection Program (“PPP”) loans, providing them an additional $480 million in funding during the first half of the year. After a record-setting 21.9% growth in deposits in 2020, our clients’ remained healthy and the recovering economy supported additional 14.4% annualized deposit growth during 2021.
Our employee engagement strategy is focused on creating and maintaining a work environment where all employees’ voices are heard. In 2021 we had 95% of our employees participate in our peopleannual employee engagement survey, which resulted in best-in-class ratings by enhancing our benefits,employees in measuring engagement in their jobs. Amid the tight labor market, we focused on developing company-wide role-based training programs, tools around performance coaching, career development, and the retention of top talent through succession planning. Additionally, we remained responsive to COVID-19 concerns and allowed flexibility for many of our training opportunities, and our communications at all levelsemployees to ensure our teams are aligned with our vision, mission, and values. We strengthened our executive team and instituted a senior leadership team. These changes allowed us to realign roles and responsibilities across the Company to enhance clarity and accountability.
continue working remotely.
We continued to enhance Company-wide systemsfocus on our long-term strategic goals to remain relevant and processesmeet the evolving needs of our clients with the implementation of our digital small business lending platform, allowing our clients to ensure continued deliveryinteract with us at their convenience and provide them with faster access to funds.
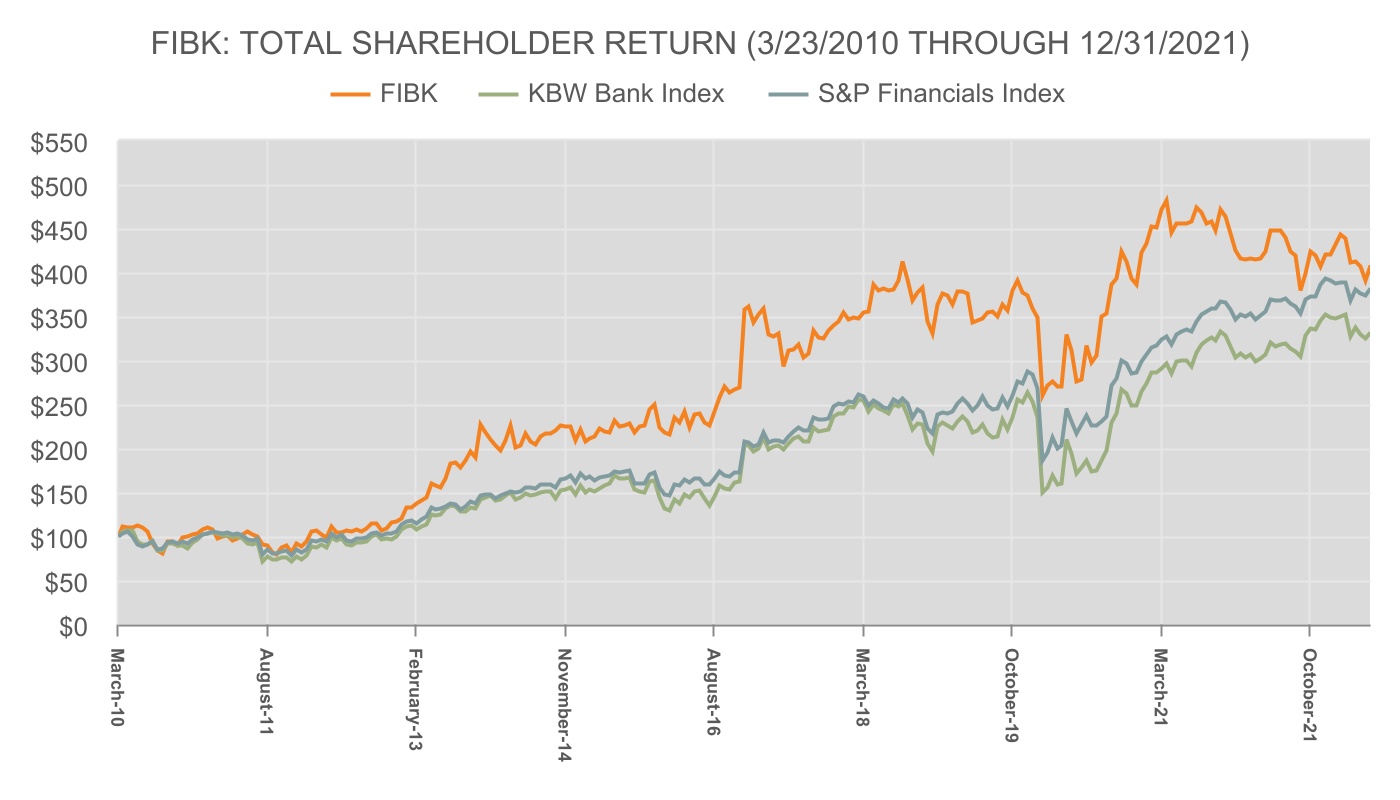
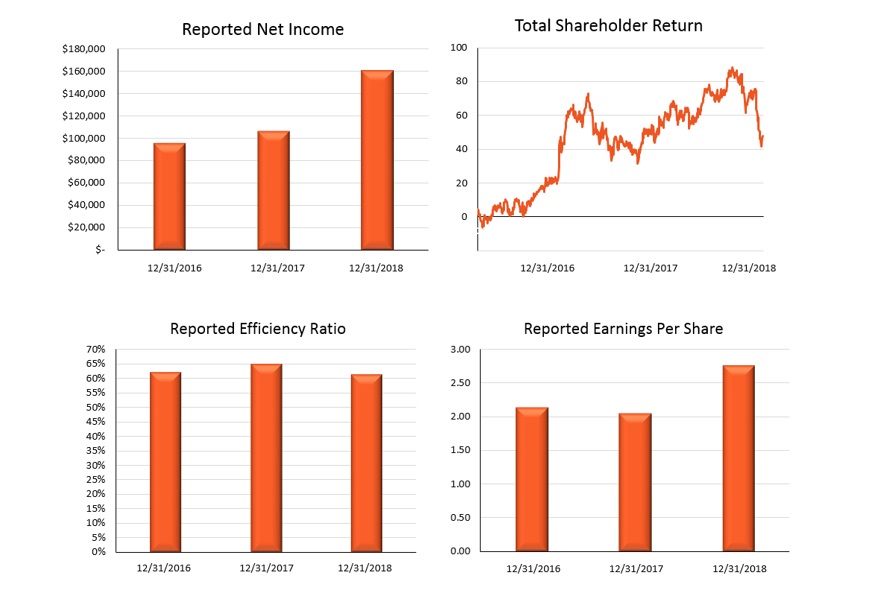
Our philosophy in how we manage our Company is driven by our focus on the long-term, sustainable success of quality productsour people, our clients, our communities and servicesultimately our shareholders. The following graphs provide information demonstrating the commitment to our clients. We are improving our loan processes to streamline and standardize workflows to allow consistent, timely interactions with our clients.
long-term financial success.
The Company continued to align itself for success as we work towards finalizing technology infrastructure projects that will support the long-term growth
Compensation of the Company. We are building a technology ecosystem that will allow us to be more flexible and adaptable to technology changes now and into the future. We are expanding our digital initiatives to allow online mortgage, credit card, and small business applications.
Underlying these efforts, the Company continues to monitor employee engagement and client satisfaction. The Company believes that satisfied employees create satisfied clients; which is good for the communities we serve, the Company, and our shareholders. Annual employee surveys provide leadership the necessary feedback to respond to areas of opportunity and to highlight and celebrate areas of success. In 2018, the Company expanded its Voice of the Client program to include client panels in all of our markets, as well as transaction based surveys and an annual client survey. We provide real time feedback to our teams which allows them to continually fine tune our in-branch client experience. Our goal is to deliver a consistent client experience across our six state footprint.
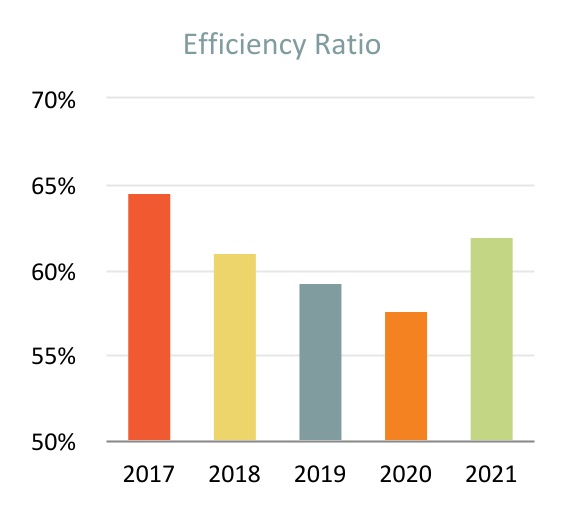
Three-year financial metrics are shown in the tables below. The 2018, 2017 and 2016 metrics include the impact of acquisition related expenses of $12.4 million, $27.2 million and $2.8 million, respectively. In 2016, non-interest income included a litigation recovery of $4.2 million.
|
|
Compensation ofNamed Executive Officers |
Our executive compensation program is aligned with our business strategy and is designed to maximize long-term shareholder value.
What We Pay and Why: Goals and Elements of Compensation: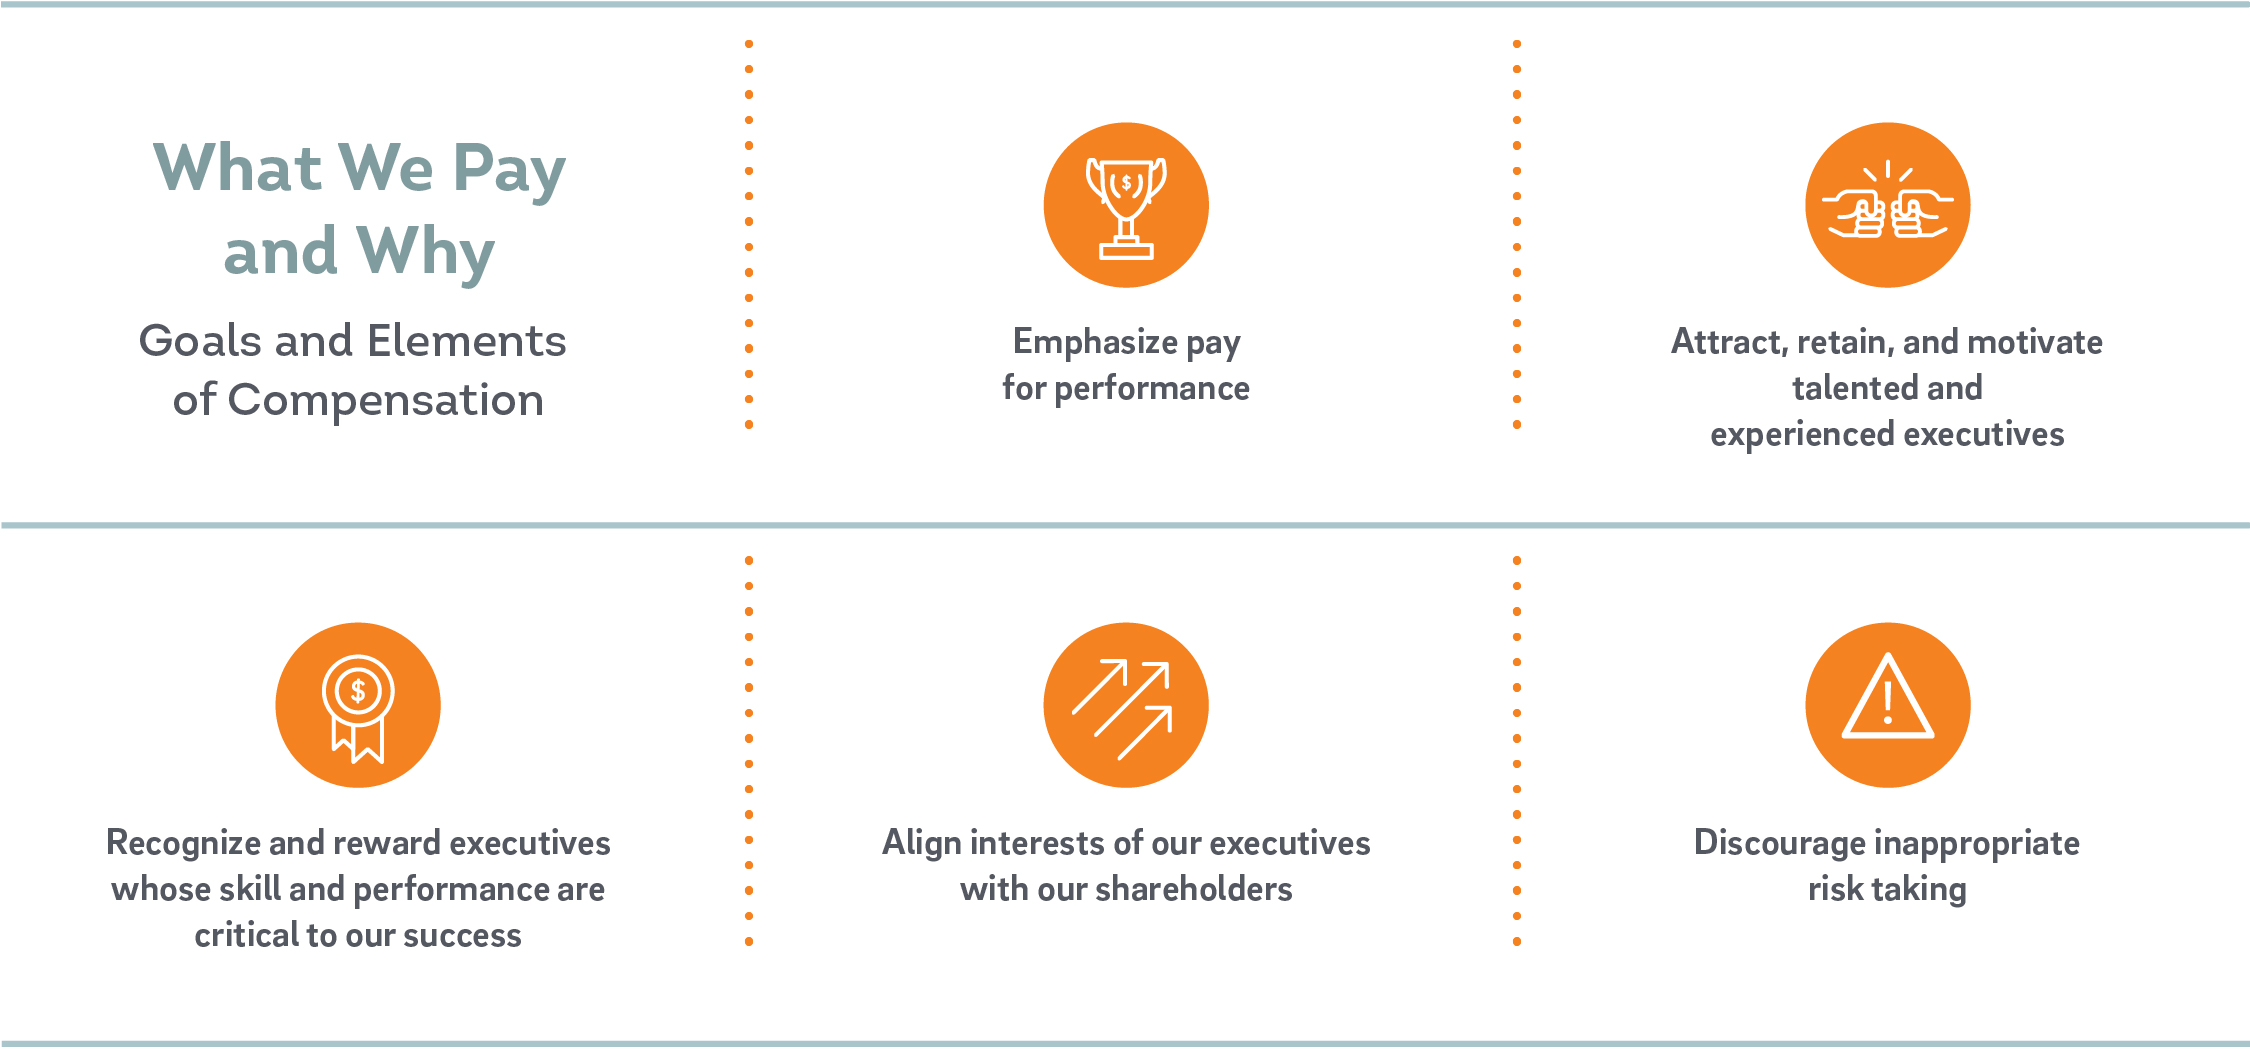
|
| | | | | | | | |
Emphasize on pay for performance | | Attract, retain, and motivate talented and experienced executives within the
banking industry
| | Recognize and reward executives whose skill and performance are critical to
our success
| | Align interests of our executives with our shareholders | | Discourage inappropriate
risk taking
|
|
| | | |
Key Features of our Executive Compensation Program: |
| | | |
What we do | What we do not do |
þ | Emphasize pay for performance | ý | Short-selling or hedging of Company securities |
þ | Use multiple performance measures and caps on potential incentive payments | ý | Single-trigger vesting of equity awards upon change in control |
þ | Use independent compensation consultant | ý | Excessive perquisites |
þ | Require minimum stock ownership for Directors and Executive Officers (EOs) | ý | Excise tax gross-ups |
þ | Maintain a clawback policy to recapture incentive payments | ý | Repricing or recycling of shares |
þ | Discourage risk taking by reserving the right to use discretion in the payout of all incentives | ý | Trading in Company securities during designated black-out periods, except under valid trading plans |
Elements of Total Compensation
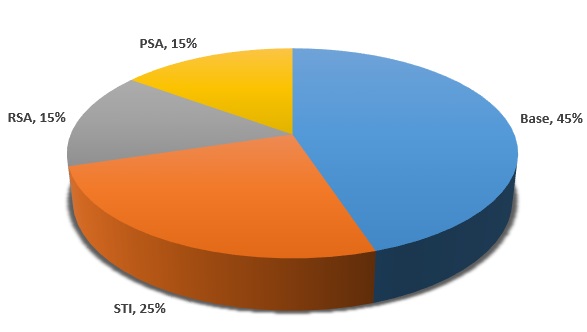
We have three primary elements of compensation: base salary, annual short-term cash incentive, and long-term stockequity award incentive.
|
| | | | |
| Average Named Executive Officer Target
Compensation Mix as of December 31, 2018
| Base Salary |
|
| | Competitive fixed base cash compensation
Amount based on individual factors such as scope of responsibility, experience, and strategic impact
Approximates 45% of total compensation |
| | | |
| Annual Short-Term Incentive (STI)
Cash Award |
|
| Awarded based on individual and Company performance
Awards not guaranteed
Awards aligned with Company financial and strategic growth objectives
Awards established at threshold, target, and maximum values
Approximates 25% of total compensation |
| | | |
| Long-Term Incentive (LTI)
Performance-Based Restricted Stock (PSA)
and Time-Based Restricted Stock (RSA) |
|
| Emphasis on long-term Company performance compared to peers
Objective is to engage and retain executive officers
Approximates 30% of total compensation |
| | | |
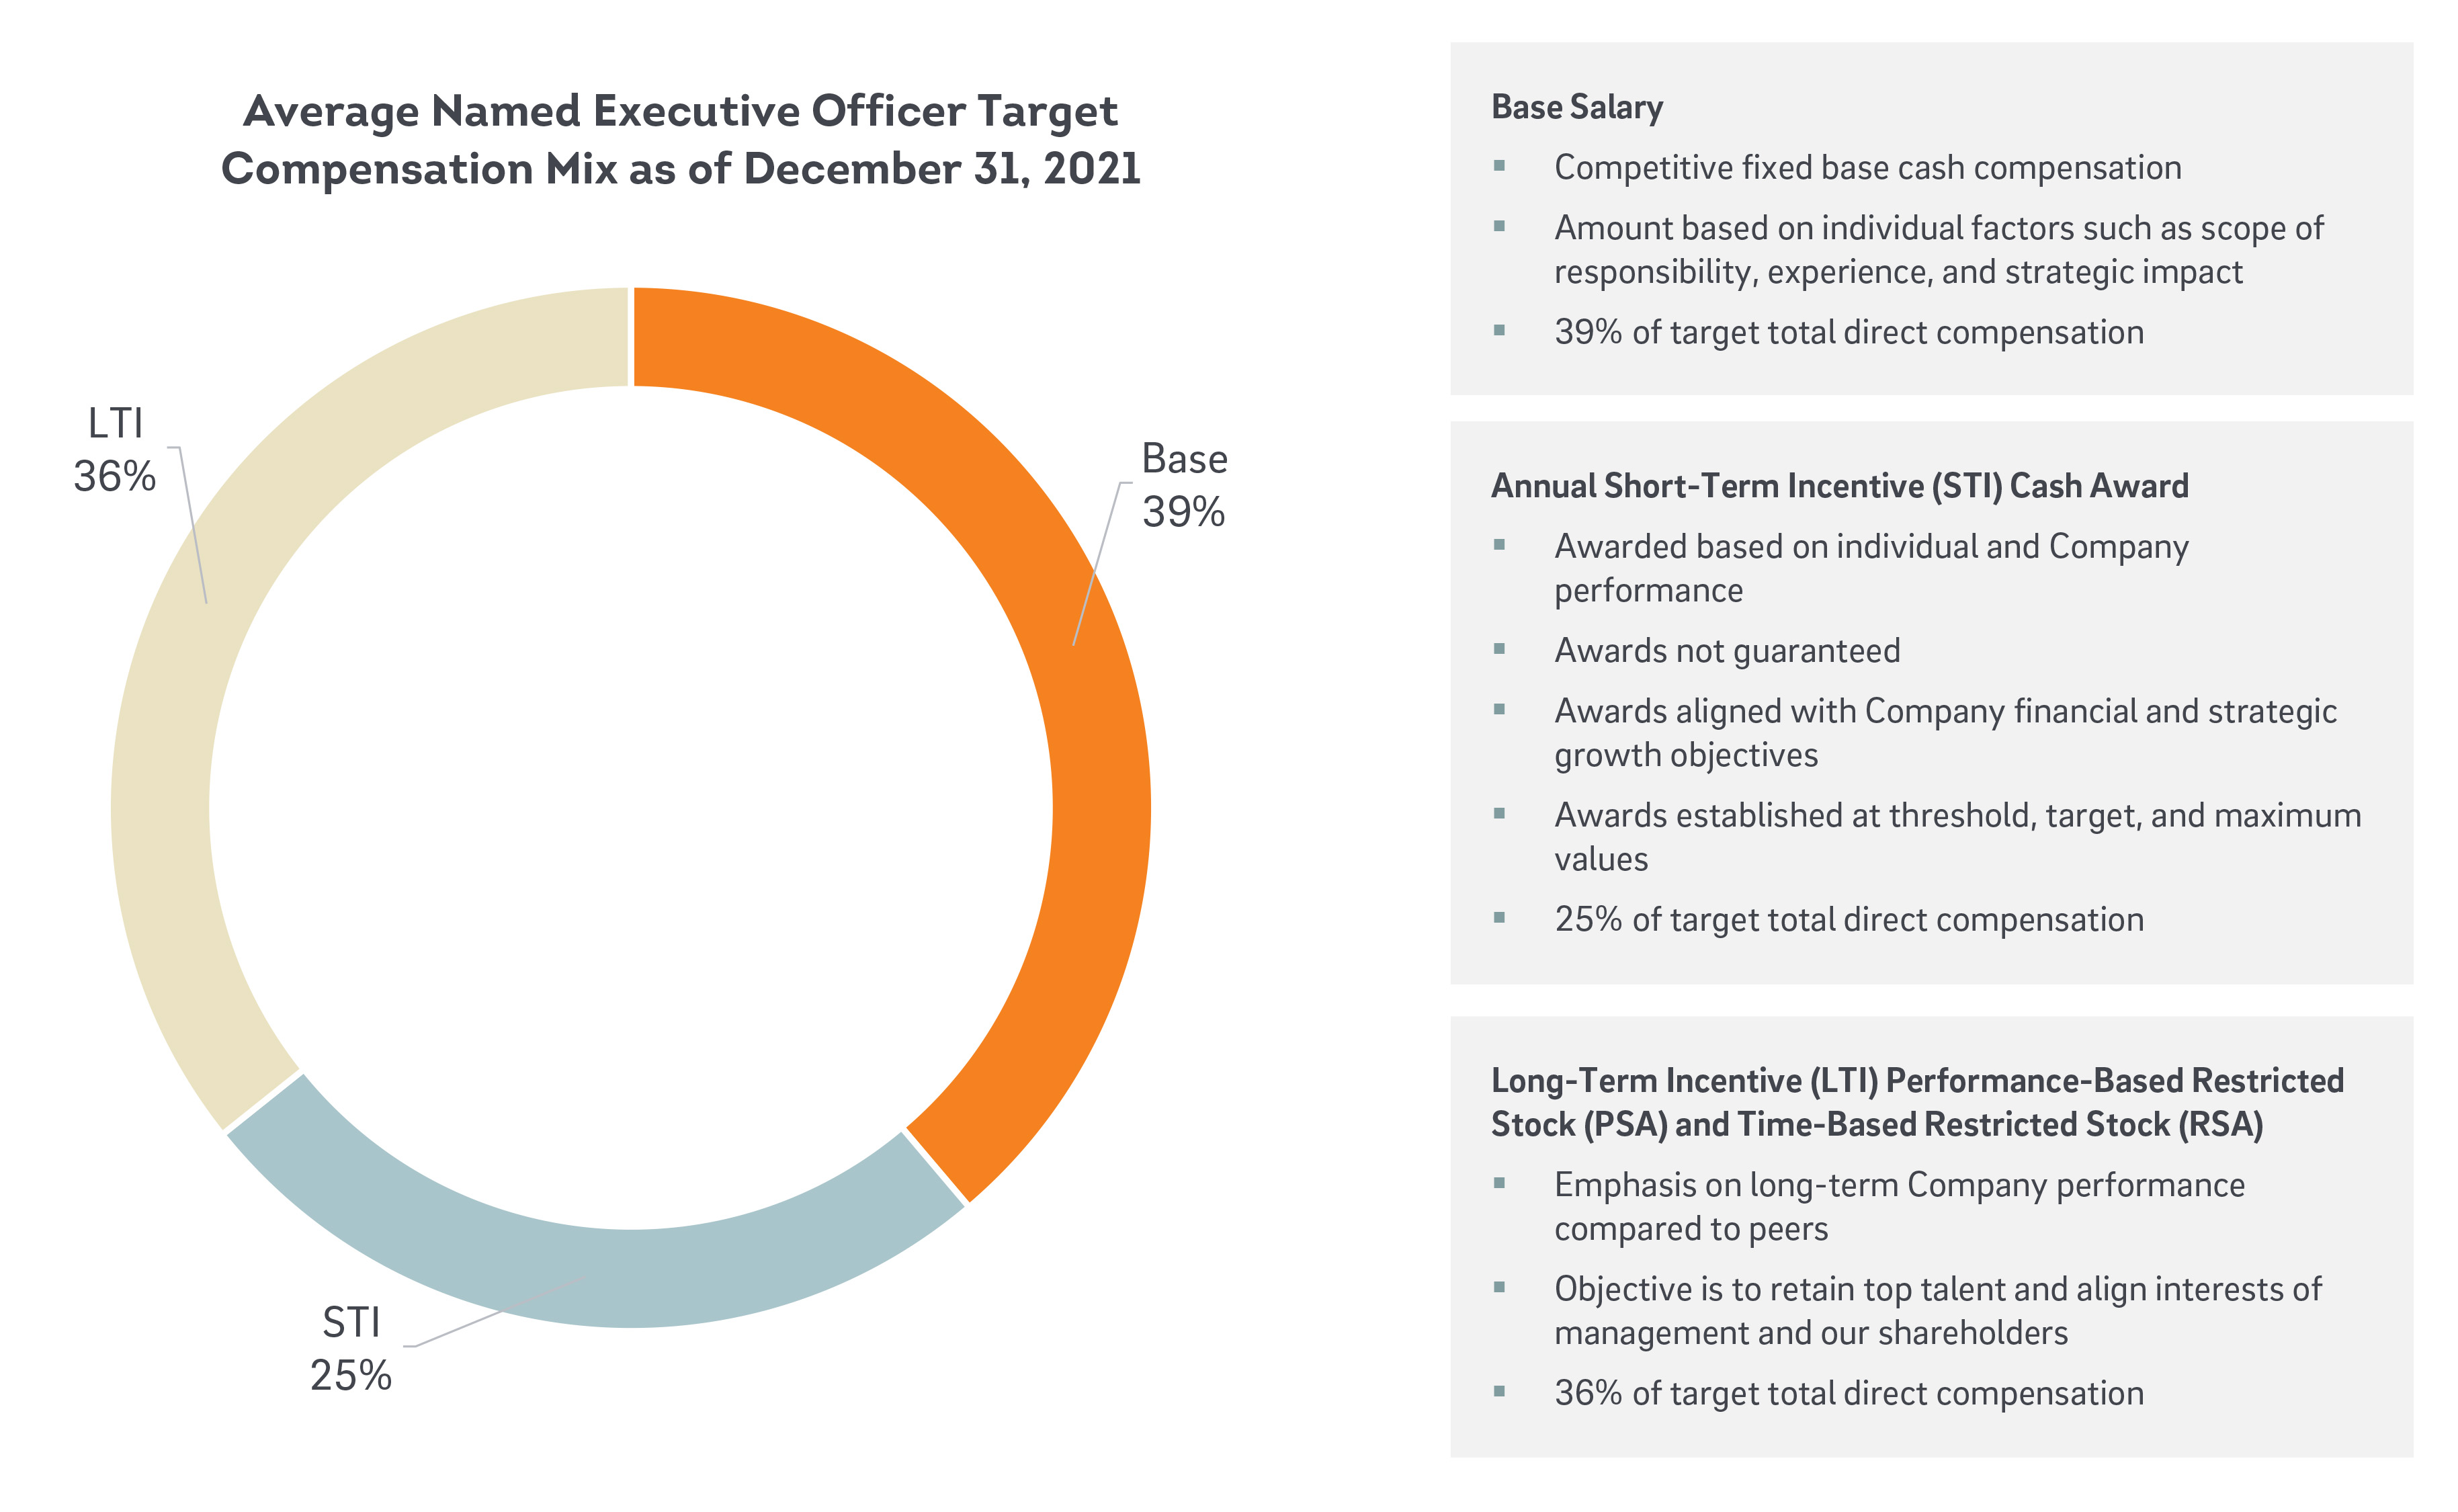
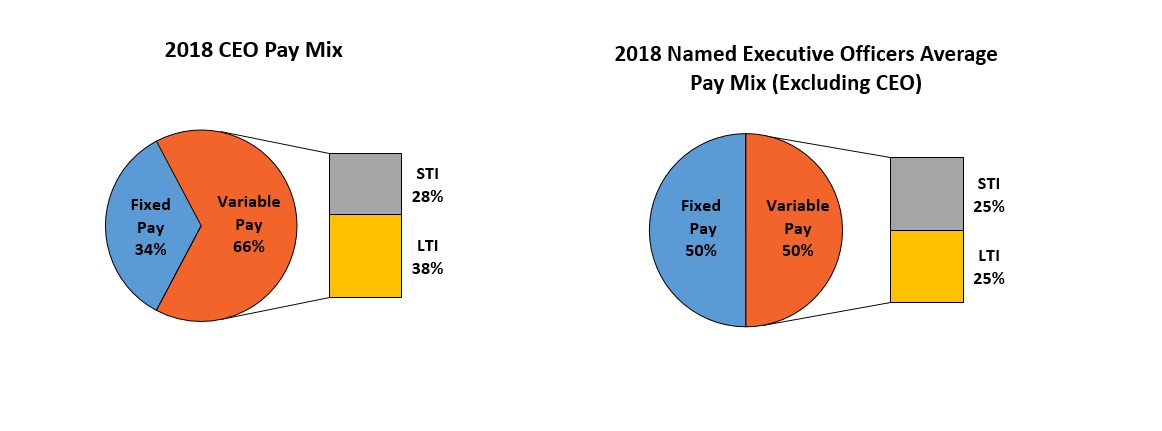
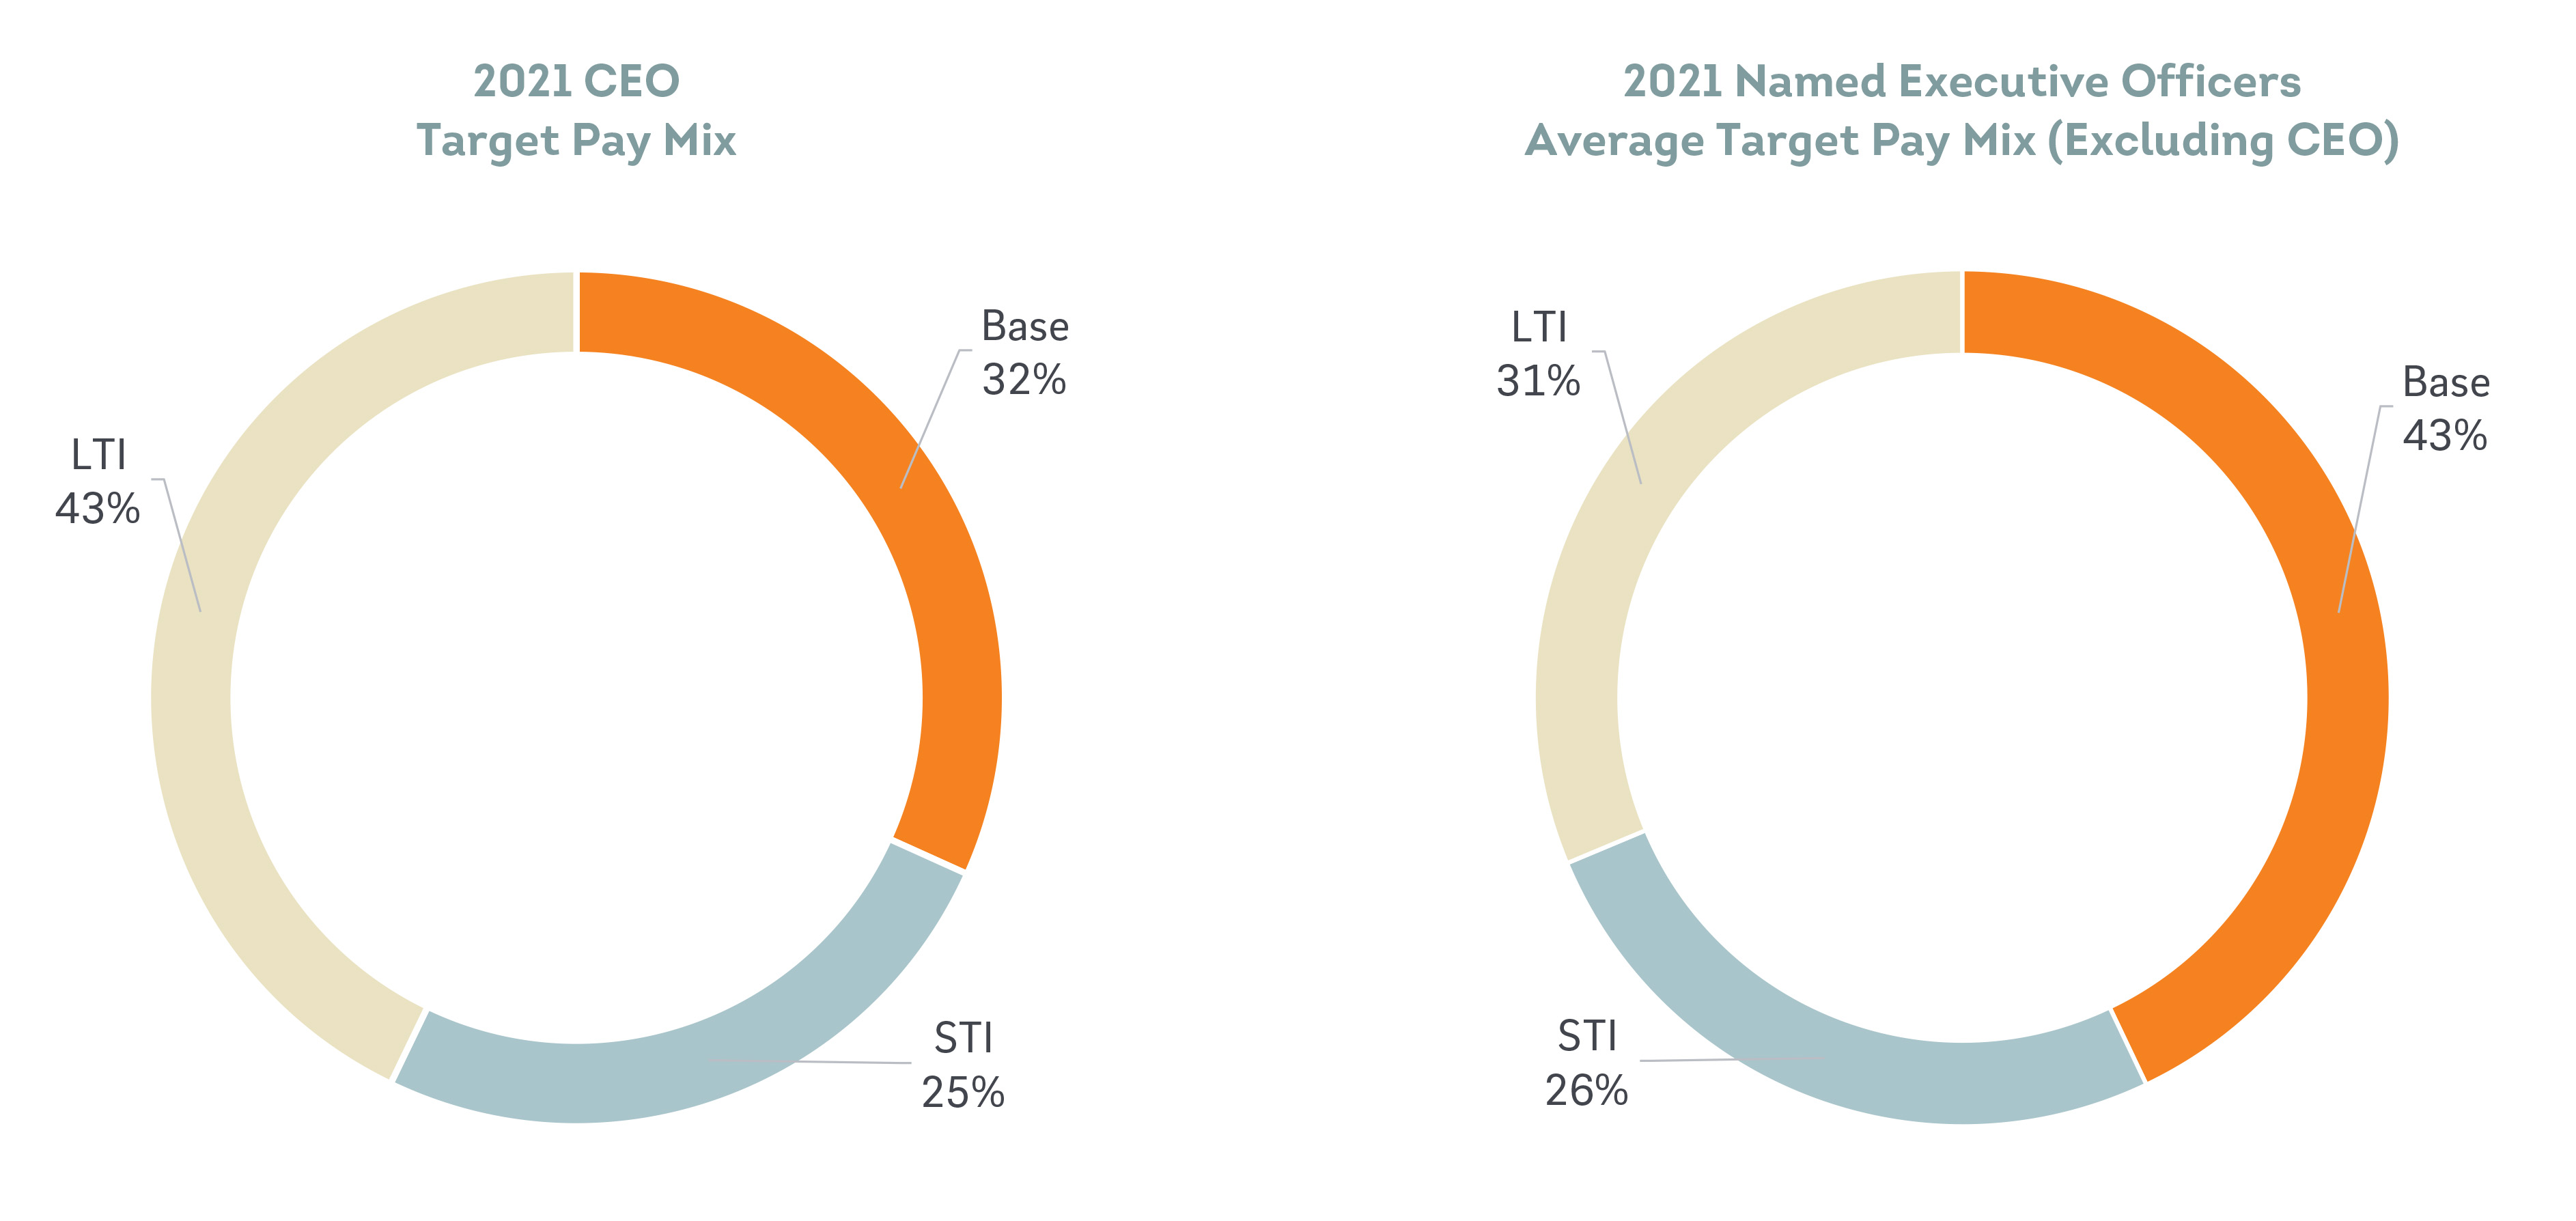
To promote a culture that aligns themanagement's interests of management with those of our shareholders, our 20182021 executive compensation program focused on an appropriatea mix of fixed and variable compensation as illustrated in the charts below.
|
|
| Factors Considered in Determining Executive Compensation |
Compensation Consultant and Management
Human Capital Committee Oversight
The Compensation and Human Capital Committee approves our compensation structure, policy, and programs to ensure we have in place appropriate executive officer incentives and employee benefits. Outside members of the Compensation and Human Capital Committee (those members who meet both the definition of a non-employee director, as that term is defined for purposes of Rule 16b-3 under the Exchange Act, and an outside director, as that term was defined for purposes of Section 162(m) of the Code),Act) have reviewed and determinedrecommended the salary, short-term incentives, and long-term equity incentives awarded to our Chief Executive Officer approvedfor approval by the Board. Additionally, the Compensation and Human Capital Committee reviewed and provided input regarding all other executive officers’ compensation and approved the total dollar value of equity awards for all other officers, taking into consideration non-binding recommendations from non-Outside Members, market analysis, inputas recommended by the Compensation Committee’s independent compensation consultant, and the recommendations of our Chief Executive Officer, except with respect to his own compensation.Officer.
Role of Compensation Consultants/Peer Group Market Analysis
We use comparative executive officer compensation data publicly disclosed by a peer group of public companies in addition to compensation survey data to evaluate the competitiveness of our executive officer compensation and to guide the compensation for newly hired executive officers. During 2018, thestay abreast of market trends. The Compensation and Human Capital Committee engaged the services of a compensation consulting firm, Pearl Meyers & Partners (PM&P),Meyer, to assist with our executive compensation review and to provide competitive market data. PM&Pdata for the purpose of informing 2021 compensation decisions. Pearl Meyer performed a comprehensive review of our executive compensation in 20182020 by obtaining proxy data based on PM&P’s recommendeda peer group approved by the Compensation and Human Capital Committee, which includes banking organizationscommercial banks or bank holding companies, as applicable, traded on major national securities exchanges with asset size, geographytotal assets between 50% and 200% of our total assets, and with geographic and operational and business model characteristics similar to ours. The peer group approved by the Compensation and Human Capital Committee for this purpose, which was selected in collaboration with Pearl Meyer, was composed of the following banks:(the “2021 Peers”):
|
| | | | | | | |
| Atlantic Union Bankshares Corp | | International Bancshares Corporation |
| BancorpSouth, Inc. | | Old National Bancorp |
| Banner Corporation | | Renasant Corporation |
| Columbia Banking System, Inc. | | Simmons First National Corporation |
| First Financial Bancorp | | South State Corporation |
| First Midwest Bancorp, Inc. | International Bancshares Corporation | Trustmark Corporation |
| Banner Corporation | Fulton Financial Corporation | NBT Bancorp, Inc. | United Bankshares, Inc. |
| Chemical Financial Corporation | Glacier Bancorp, Inc. | Old National Bancorp | United Community Banks, Inc. |
| Columbia Banking System, Inc. | Great Western Bancorp, Inc. | Renasant Corporation | Washington Federal, Inc. |
| First Financial Bancorp | Heartland Financial USA Inc. | Simmons First National Corporation | WesBanco, Inc. |
Changes to the peer group from the previous year include the addition of Great Western Bancorp, Inc. and Heartland Financial USA Inc., each of which was added based on its asset size, operating revenues, market capitalization, and business models. F.N.B. Corporation and IBERIABANK Corporation were removed from the peer group because they no longer met the relevant criteria to be included.
The Compensation Committee exercises its business judgment and discretion in determining executive compensation and generally targets market competitive (50th percentile) base pay, incentives, and total cash compensation within the peer group.
|
|
| Analysis of Executive Officer Compensation |
Base Salaries
The Compensation and Human Capital Committee and the full Board, based in part on the committee’s recommendation, approved the 20182021 base salary offor Mr. Riley, our current Chief Executive Officer, and the Compensation and Human Capital Committee approvedreviewed and provided input regarding the 2018 compensation of2021 base salaries for the other executive officers, including the Named Executive Officers,NEOs, as recommended by our Chief Executive Officer. Increases to base salarysalaries for our executive officers who were also NEOs in 2020 ranged from 0%2% to 25%5% in 2018, and2021. Increases to base salaries for all executive officers from prior years were based on the Compensation Committee’s review of market data from the disclosures of our peer group defined above,2021 Peers and from published surveys, as well as the results achieved by each executive his or herofficer and their future potential, scope of responsibilities, and experience.
The following table shows the 20182021 base salary of each Named Executive Officer.
|
| |
Officer | 12/31/2018
Base Salary ($)
|
Kevin P. Riley | $752,580 |
Marcy D. Mutch | 385,000 |
Jodi Delahunt Hubbell | 375,000 |
Kirk D. Jensen | 319,000 |
Philip Gaglia | 259,600 |
William D. Gottwals | 350,000 |
Stephen W. Yose | 336,000 |
| | | | | | | | | | | | | | | | | |
| Officer | 12/31/2021
Base Salary ($) | % Increase | 12/31/2020
Base Salary ($) | % Increase | 12/31/2019
Base Salary ($) |
| Kevin P. Riley | 870,975 | 5.0 | % | 829,500 | 5.00 | % | 790,000 |
| Marcy D. Mutch | 467,250 | 5.0 | % | 445,000 | 7.23 | % | 415,000 |
| Jodi Delahunt Hubbell | 446,119 | 5.0 | % | 424,875 | 10.00 | % | 386,250 |
| Russell A. Lee | 367,200 | 2.0 | % | 360,000 | 2.86 | % | 350,000 |
| Kirk D. Jensen | 347,140 | 2.1 | % | 340,000 | 3.48 | % | 328,570 |
Short-Term Incentives
OurConsistent with the overall compensation philosophy of linking incentive awards to Company-wide and individual performance, our executive officers are eligible for annual cash-basedperformance-based, short-term incentives under the 2015 Equity Incentive Plan. cash incentives.
The Compensation and Human Capital Committee setsrecommends, and the targetBoard of Directors approves, financial metrics that are considered in awarding short-term incentives. Our employees’ opportunity offor the short-term incentive awards asis based on a percentage of an executive’seligible employees' base salary. Varying short-term incentive award percentages reflect the Compensation Committee’s belief that an executive officer’s scope of work, responsibilities, and performance should all be considered when awarding incentives. The Company’s award opportunities are established at threshold, target, and maximum levels. The funding percentage between each of the levelslevel is interpolated on a linear basis, with the funding percentage to be 0% for all performance below the threshold level. The maximum payout opportunity for each metric is capped at 150% of the target percentage. The plan also has a discretionary component whereby the Compensation Committee can choose to apply a modifier to the calculated funding percentage based on the Company’s performance. For 2018, the discretionary areas the Committee reviewed were in the areas of customer satisfaction and employee engagement. The discretionary modifier allows the Committee to adjust the short-term funding percentage plus or minus 10%. The performance goals for the Named Executive Officers wereNEOs are established in January 2018. As a group, the Named Executive Officers’ short-term incentive payouts in 2018, after the applicationfirst quarter of the Committee’s exercise of its discretion, were 100.27% of target.
Named Executive Officer Short-Term Incentive
each year.
The 20182021 short-term incentive plan opportunity for the Named Executive OfficersNEOs was based primarily on two metrics related to our 2021 financial performance. Sixty percent (60%) of the STI Plan opportunity was based on 2018 Company performance. Metrics includedearnings per share (EPS), adjusted net incomefor: (1) tax adjusted impacts related to our Allowance for Credit Losses (ACL) as determined under the accounting standard related to the CECL methodology, (2) non-operating expenses related to a litigation settlement, and adjusted(3) acquisition-related costs ("Adjusted EPS"). Forty percent (40%) was based on the efficiency ratio, which overall were at 96.21%adjusted for: (1) impacts related to OREO expense/income (2) investment security gains/losses (3) non-operating expenses related to a litigation settlement and (4) acquisition-related costs (“Adjusted Efficiency Ratio”). The incentive plan opportunity also included two subjective modifiers of target. The Committee determined+/- 5% each, for (1) Relative improvement in Credit Quality as compared to our 2021 Peers, emphasizing the outcome for thequality of our loan portfolio, and (2) a Board discretionary componentmodifier, focused on the basis of the results for the Company’s 2018 employee engagement and customer satisfaction surveys. Based on the survey results, the Committee approved a positive modifier of 5% to be appliedour continued risk-focused response to the base results.global pandemic.
The target Adjusted EPS performance goal was established at $2.96, with a threshold requirement of $2.66, and a requirement of $3.26 for maximum payout. The target Adjusted Efficiency Ratio goal was established at 59.26%, with a threshold ratio of 61.26% and maximum payout rate for a ratio at or below 57.26%. These metrics were aligned with the 2021 operating objectives of the Company’s business with 100%established at the beginning of the awardyear. A reconciliation of Adjusted EPS, a non-GAAP financial measure, to EPS, its most directly comparable GAAP financial measure, is provided below under the caption “Reconciliation of Adjusted EPS and Adjusted Efficiency Ratio.”
At the time the 2021 performance goals were established, the Committee determined it was not appropriate to reward short term incentives as a result of the provisioning (or recovery) of loan losses, due to indeterminable impact economic recovery might have on the required Allowance for Credit Losses (ACL).
As a result, the Adjusted EPS target in the STI Plan provided for a provision expense of $15 million which was determined based on expected loan growth and the level of net charge-offs. Any provision expense or release outside of this pre-determined amount was added back to earnings on an after-tax basis to determine EPS for purposes of meeting the target EPS levels defined in the plan. The Committee believed, and the Board concurred, that this methodology still demonstrated a direct link between the Company’s goals, the outcomes achieved, and payouts awarded to its employees.
Two subjective modifiers were evaluated in determining the STI award: credit quality trending to peers and a Board discretionary modifier. Each modifier could adjust STI by up to +/-5%. The Committee reviewed the Company’s credit quality metrics compared to its 2021 Peers, including Criticized Loans/Total Loans, Classified Loans/Total Loans, and Non-Performing Assets/Total Loans, and determined the Company met the criteria to apply a 5% subjective modifier to increase the STI calculated performance award. The second discretionary modifier evaluated by the Committee was based on the Company’s overallsuccessful financial performance during an evolving economic climate, the thorough due diligence and eachnegotiation process related to the Great Western Bancorp acquisition, and the continued efforts related to employee well-being during the global pandemic, among other factors. Varying short-term incentive award percentages for NEOs reflect the recommendations made by the CEO with input from the Compensation and Human Capital Committee. It is the Compensation and Human Capital Committee’s belief that an executive officer’s accomplishments measured against individualscope of work, responsibilities, and performance plan objectives. should all be considered when awarding incentives.
Reconciliation of Adjusted EPS and Adjusted Efficiency Ratio
Adjusted EPS and Adjusted Efficiency Ratio are financial measures that are not presented in accordance with GAAP and are included herein because the Compensation and Human Capital Committee and the Board utilize such terms in connection with determining management’s performance under our short-term incentive plan. A reconciliation of such measures to their most directly comparable GAAP financial measures is calculated as follows:
| | | | | | | | |
| (In millions, except % and per share data) | As of December 31, 2021 |
| Adjusted EPS | Provision Adjustment | EPS |
| Net income and EPS | $ | 192.1 | | $ | 3.11 | |
| Less: GAAP recovery of credit loss, adjusted for taxes | -11.2 | |
| Less: Budgeted provision for credit losses, adjusted for taxes | -11.6 | |
| Add: Litigation settlement, adjusted for taxes | 0.8 | |
| Add: Acquisition-related costs, adjusted for taxes | 8.9 | |
| Weighted average common shares outstanding for diluted earnings per common share computation | 61,741,828 | | |
| Adjusted Net Income and EPS | $ | 179.0 | | $ | 2.89 | |
| | |
| Adjusted Efficiency Ratio | | |
| Non-interest expense | $ | 405.5 | | |
| Non-interest income | 150.5 | |
| Net interest income | 488.2 | |
| Core deposit intangibles amortization | 9.9 | | |
Efficiency ratio(1) | | 61.94 | % |
| OREO income | $ | (0.2) | | |
| Investment security gains | 1.1 | |
| Litigation settlement | 1.0 | |
| Acquisition-related costs | 11.6 | |
Adjusted Efficiency Ratio(2) | | 60.05 | % |
(1) The Company utilizes the FDIC definition as our reported efficiency ratio as non-interest expense less amortization of intangible assets as a percent of net interest income plus non-interest income.
(2) Adjusted Efficiency Ratio is calculated utilizing the FDIC definition above and excludes OREO income, litigation settlement, and acquisition-related costs from non-interest expense and investment security gains from non-interest income.
Short-term incentive fundinggoals and performance outcomes under the STI plan (prior to adjustment for assessment of individual performance) were as follows:
| | | | | | | | | | | | | | | | | | | | |
| | Performance Goals | | |
| Performance Measure | Weight | Minimum 50% of Target | Target Performance | Maximum 150% of Target | Adjusted EPS/ Adjusted Efficiency Ratio | Actual Performance, As Adjusted |
| Adjusted Earnings Per Share* | 60 | % | $2.66 | $2.96 | $3.26 | $2.89 | 52.68 | % |
| Adjusted Efficiency Ratio* | 40 | % | 61.26 | % | 59.26 | % | 57.26 | % | 60.05 | % | 32.10 | % |
| Payout Ratio Before Modifier | | | | | | 84.78 | % |
| Total Payout Ratio Adjusted for 10% Modifiers | | | | | | 93.26 | % |
*See reconciliation to most directly comparable GAAP financial measures in the Company in 2018 was 101.02% of target.table above.
|
| | | | | | | |
| | | Performance Targets | Actual Performance |
| | | Threshold | Base | Target | Maximum | | |
| Performance Measure | Weight | 50% Payout | 100% Payout | 125% Payout | 150% Payout | Amount | Weighted Average Funding Percentage |
Net Income, as adjusted* ($ in ‘000s) | 60% | $144.25 | $161.22 | $169.70 | $178.19 | $169.50 | 74.61% |
| Efficiency Ratio, as adjusted* | 40% | 59.24% | 57.24% | 56.24% | 55.24% | 59.08% | 21.60% |
| | | | | | | | 96.21% |
| Discretionary Modifier Applied | |
|
| | 5.0% | 4.81% |
| Total | |
| | | | | 101.02% |
| * Excludes tax adjusted acquisition expenses |
Short-term incentivesSTI plan payouts for the Named Executive Officers ranged from 64% to 117%NEOs were 93.26% of target opportunity in 2018.2021. The following table shows the 2018 short-term incentive2022 STI plan payouts for each Named Executive Officer.NEO.
| | | | | | | | | | | | | | | | | | | | |
| | Performance Goals | Actual |
| Officer | 12/31/2021
Base Salary
($) | Target
% of Base Salary | 2021
Target Value | Actual
% of Target Value | 2021 Actual
Total Payout Value ($) | Weighted Average Payout % |
| Kevin P. Riley | $ | 870,975 | | 80 | % | 696,780 | 93.26 | | $ | 649,817 | | |
| Marcy D. Mutch | 467,250 | 60 | % | 280,350 | 93.26 | | 261,454 | |
| Jodi Delahunt Hubbell | 446,119 | 60 | % | 267,671 | 93.26 | | 249,630 | |
| Kirk D. Jensen | 347,140 | 50 | % | 173,570 | 93.26 | | 161,871 | |
| Russell A. Lee | 367,200 | 60 | % | 220,320 | 93.26 | | 205,470 | |
| Total | $ | 2,498,684 | | | $ | 1,638,691 | | | $ | 1,528,242 | | 93.26 | % |
|
| | | | | | | | | |
| | | Performance Goals | Actual |
| Officer | 12/31/2018 Base Salary ($) | Target % of Base Salary | 2018 Target Value | Actual % of Target Value | 2018 Actual
Total Payout Value | Weighted Average Payout % |
| Kevin P. Riley | 752,580 | 80 | 602,064 | 100 | 602,064 |
| (1) | |
| Marcy D. Mutch | 385,000 | 50 | 192,500 | 117 | 225,000 |
| (2) | |
| Jodi Delahunt Hubbell | 375,000 | 50 | 187,500 | 107 | 200,000 |
| (3) | |
| Kirk D. Jensen | 319,000 | 50 | 159,500 | 100 | 160,000 |
| (4) | |
| Philip Gaglia | 259,600 | 50 | 129,800 | 116 | 150,000 |
| (5) | |
| William D. Gottwals | 350,000 | 50 | 175,000 | 64 | 112,000 |
| (6) | |
| Stephen W. Yose | 336,000 | 50 | 168,000 | 101 | 169,680 |
| (7) | |
| Total | | | $1,614,364 | | $ | 1,618,744 |
| | 100.27% |
(1) Mr. Riley received a 2018 short-term incentive payout of $602,064, which included 100% of Mr. Riley’s target short-term incentive based on Company performance. The total award of $602,064 is reflected in the Bonus (STI) column in the Summary Compensation table.
(2) Ms. Mutch received a 2018 short-term incentive payout of $225,000, which included $194,464, or 101.02% of Ms. Mutch’s target short-term incentive based on Company performance, and an additional $30,536 based on Ms. Mutch’s individual accomplishments against her performance plan. The total award of $225,000 is reflected in the Bonus (STI) column in the Summary Compensation table.
(3) Ms. Delahunt Hubbell received a 2018 short-term incentive payout of $200,000, which included $189,413, or 101.02% of Ms. Delahunt Hubbell’s target short-term incentive based on Company performance, and an additional $10,587 based on Ms. Delahunt Hubbell’s individual accomplishments against her performance plan. The total award of $200,000 is reflected in the Bonus (STI) column in the Summary Compensation table.
(4) Mr. Jensen received a 2018 short-term incentive payout of $160,000, which included $159,500, or 100% of Mr. Jensen’s target short-term incentive based on Company performance, and an additional $500 based on Mr. Jensen’s individual accomplishments against his performance plan. The total award of $160,000 is reflected in the Bonus (STI) column in the Summary Compensation table.
(5) Mr. Gaglia received a 2018 short-term incentive payout of $150,000, which included $131,124, or 101.02% of Mr. Gaglia’s target short-term incentive based on Company performance, and an additional $18,876 based on Mr. Gaglia’s individual accomplishments against his performance plan. The total award of $150,000 is reflected in the Bonus (STI) column in the Summary Compensation table.
(6) Mr. Gottwals received a 2018 short-term incentive payout of $112,000. Mr. Gottwal’s short-term incentive would have been $176,785, or 101.02% of his target short-term incentive, based on Company performance, had he achieved his individual performance plan objectives.
(7) Mr. Yose received a 2018 short-term incentive payout of $169,680, which included 101% of Mr. Yose’s target short-term incentive based on Company performance.
Long-Term Incentives
We believe long-term equity incentive compensation encourages employees to focus on our long-term performance. Long-term incentives in the form of equity compensation also provide an opportunity for executive officers and certain designated key employeessenior leadership to increase their equity ownership in the Company, further aligning their interests with those of our shareholders.
Under the Company's 2015 Equity Incentive Plan, as amended, the Compensation and Human Capital Committee approves equity awards for directors and the CEO, and reviews and provides input to the CEO regarding equity awards to certain officers, including the NEOs. Awards are granted to enhance our ability to attract, retain, and motivate employees by providing them with both equity ownership opportunities and performance-based incentives intended to align their interests with those of our shareholders. The Compensation and Human Capital Committee has delegated authority to the Company’s Chief Executive Officer, subject to certain terms and limitations as established by the Committee, to make awards to employees who are not Section 16 officers. For additional information regarding our equity compensation plans, see the information provided under the caption “Equity Compensation Plans” included in this proxy statement.
2021 Long-Term Incentives Awarded
In 2018,2021, long-term incentives awarded to the Named Executive OfficersNEOs included an equala mix of performance-vestedperformance (60% of the award) and time- vestedtime-based vesting (40% of the award) restricted stock.stock awards. Our Chief Executive Officer’s target long-term incentive award is equal to approximately 105%130% of his base salary, and the remaining Named Executive Officers’NEOs’ target long-term incentive awards are equal to approximately 50%range from 50-80% of their base salaries. The value ofsalaries, consistent in each case as intended and approved by the Compensation and Human Capital Committee for the NEOs also in 2020. In 2020 for our Chief Executive Officer, however, his long-term incentive award was inadvertently established at the then prior year’s lower approximately 110% base salary award level. In order to rectify the circumstances and put the CEO in as close to the same position as he would have been had his award been determined at the appropriate 130% level, the committee approved an additional long-term incentive award in 2021 to make up the difference (on the same terms as the other 2021 long-term incentive awards for the CEO), including making a de minimus cash payment to our officers, including the Named Executive Officers, is based primarilyMr. Riley for dividends that would have accrued on the individual’s ability to influenceshares underlying the Company’s long-term growth and profitability.
Time vested restricted stock awards have a three-year graded vesting period. Performance vested restricted stock awards vestcatch-up award had it been made in varying percentages based upon the Company’s performance relative to that of a peer group composed of the SNL Financial index (“SNL Index”) of bank holding companies with total assets between 50% and 200% of our December 31, 2018 total assets. The 2019 award vesting percentages range from 0% to 200% of target and are based on the Company’s three-year return on equity weighted at 40% and the three-year total shareholder return weighted at 60%. The measurement period for 2019 performance vested restricted stock awards runs from January 1, 2019 to December 31, 2021 using the previous 12 quarters’ performance. The performance awards granted in 2019 will vest on March 15, 2022.
The award range for the 2019 awards is interpolated on a linear basis, except that the adjustment percentage will equal 0% for a ranking below the 35th percentile. Vesting is2020 as follows:
|
| |
Percentile Ranking | Award Range |
Below 35th percentile | 0% |
35th percentile | 50% |
50th percentile | 100% |
90th percentile | 200% |
intended. All awards under our equity compensation plan are based on the closing price of the underlying common stock as quoted on NASDAQ Stock Market for the last market trading day prior to the date of the award. Dollar values of the annual
Time-based vesting restricted equity awards of long-term incentives to executives have historically been approved at the Compensation Committee’s regularly scheduled meetinga three-year graded vesting period. Performance-based vesting restricted equity awards vest in January with the date of the awards specified at that time.
Results of the 2016 Long Term Incentive Performance Awards
Performance vested restricted shares awarded to executive officers in 2016 for the measurement period January 1, 2016 through December 31, 2018 are scheduled to vest on March 15, 2019. The 2016 performance vested restricted shares will vestvarying percentages based upon the Company’s performance relative to that of a peercomparator group comprisedcomposed of the SNL Financial Index ofall U.S. commercial banks or bank holding companies, as applicable, traded on a major exchange with total assets between 50% and 200% of our December 31, 20162020 total assets and were
The 2021 performance-based vesting awards vest in percentages ranging from 0% to 200% of target, based on First Interstate’sthe Company’s three-year returnAdjusted Return on average assets, three-year return on average equityAverage Equity (weighted at 50%) and the three-year average total shareholder return.return (weighted at 50%) as compared to the comparators (the "percentile ranking"). Adjusted Return on Average Equity is defined as Adjusted Net Income divided by Average Equity. Adjusted Net Income is defined as pretax net income, minus non-recurring revenue items, plus non-recurring expense items, with non-recurring items being defined by S&P Global (or its successor.) The measurement dateperiod for 2016 performance vested restricted stock2021 performance-based vesting awards wasis from January 1, 2021 to December 31, 2018 using2023. The performance-based vesting awards granted in 2021 will vest to the previous 12 quarters’ performance.extent the performance criteria are met with respect to such awards on March 15, 2024.
The pre-defined performance objectives for January 1, 2016 through December 31, 2018 were as follows:
|
| | | | | | | | |
| Goal | | Percentile Rank | | Unweighted % of Target Award | | Goal Weight | | Weighted % of Target Award |
| Return on average assets | | 56.70% | | 91.75% | | 33.33% | | 30.58% |
| Return on average equity | | 61.9% | | 104.75% | | 33.33% | | 34.92% |
| Total shareholder return | | 77.4% | | 150% | | 33.33% | | 50.00% |
| Total | | | | | | 100.00% | | 115.50% |
The award range for2021 performance-based vesting awards will vest based upon the 2016 performance vested restricted shares wasfollowing scale, interpolated on a linear basis with minimum performance threshold defined as the 35th percentile. Vesting for the 2016 performance vested restricted shares is as follows:
|
| | | | |
| Percentile Ranking | Award Range |
| Below 35th percentile | 0% |
40th35th percentile (linear interpolation) | 50% |
| 50th percentile | 75% |
60th percentile (linear interpolation) | 100% |
70th90th percentile | 125% |
75th percentile | 150%200% |
2019 Long-Term Incentive Performance Results
Performance-based vesting restricted awards granted to executive officers in 2019 vested on March 15, 2022. The measurement period for the performance-based vesting restricted awards was from January 1, 2019 through December 31, 2021. The awards vested based upon the Company’s performance relative to a comparator group composed of all U.S commercial banks or bank holding companies, as applicable, traded on a major exchange with total assets between 50% and 200% of our December 31, 2018, total assets, and were based on our three-year return on average equity, and the three-year total shareholder return.
The performance results were as follows:
| | | | | | | | | | | | | | | | | |
| Goal | | Percentile Rank | Unweighted
% of Target Award | Goal Weight | Vesting % |
| Return on equity | | 50.25% | 100.62% | 50% | 50.31% |
| Total shareholder return | | 28.00% | —% | 50% | —% |
| Total | | | | 100% | 50.31% |
Comprehensive Benefits Package
We provide a competitive benefits package to all full-time employees, including the Named Executive Officers,NEOs, that includes health and welfare benefits such as medical, dental, vision care, disability insurance, and life insurance benefits, and a 401(k) savings plan. We also provide a profit sharing plan for all non-temporary employees under which contributions are made as authorized by our Board. Participants vest in profit sharing amounts after three years of service.
We provide a non-qualified deferred compensation plan under which eligible participants, including our NEOs, may defer a portion of their base salary, or short-term incentives and, if applicable, supplemental executive retirement plan contributions, subject to certain maximums as set forth by the plan administrator. Additionally, we make discretionary contributions on behalf of the executive officer participants for 401(k) plan matching contributions and profit sharing contributions in excess of Code limitations. Other contributions on behalf of a participant may be made at the discretion of our Board.
We have obtained life insurance policies covering selected officers of our banking subsidiary, First Interstate Bank, including certain of our Named Executive Officers.NEOs. Under these policies, we receive benefits payable upon death of the insured. An endorsement split dollar agreement or survivor income benefit agreement has been executed with each of the insureds whereby a portion of the death benefit or a lump-sum survivor benefit is payable to the insured’s designated beneficiary if the participant is employed by us at the time of death.
Perquisites offered to the Named Executive Officers may include payment of the following: social club dues and the use of a Company automobile.
2021 Other Compensation Matters
Severance and Change-in-Control Benefits
We provide severance pay and other benefits to executive officers, including the Named Executive Officers,NEOs, who have their employment terminated, including through involuntary termination by us without cause and, in some cases, voluntary termination byof the executive for good reason. These arrangements provide security of transition income and benefit replacements that allow such executives to focus on our prospective business priorities that create value for shareholders. We believe the level of severance and benefits provided by these arrangements is consistent with the practices of our 2021 peers and are necessary to attract and retain key employees. Potential payments and benefits available under these arrangements are discussed further under the caption “Potential Payments upon Termination or Change of Control.”Control” included elsewhere in this proxy statement.
Tax Considerations
Section 162(m) of the Internal Revenue Code of 1986, as amended (the "Code"), generally disallows an income tax deduction to public companies for annual compensation in excess of $1 million paid to the chief executive officer, the chief financial officer, and the three other most highly compensated Named Executive OfficersNEOs for the taxable year. For periods prior to 2018, compensation that qualified as “performance-based” or satisfied another exception was excluded for purposes of calculating the amount of compensation subject to the $1 million limit. For taxable years beginning after December 31, 2017, however, the exemption from the Section 162(m) deduction limit for performance-based compensation has been repealed, by the Tax Cuts and Jobs Act of 2017, such that compensation paid to our Named Executive OfficersNEOs in excess of $1 million will not be deductible unless it qualifies for transition relief applicable to certain arrangements in place as of November 2, 2017, for performance-based compensation. The Compensation and Human Capital Committee considers tax and accounting consequences in developing and implementing our executive compensation program and believes that compensation paid under our management incentive plans in taxable years prior to 2018 is generally fully deductible for federal income tax purposes. Deductibility of awards will likely continue as one factor in determining executive compensation, but the Compensation and Human Capital Committee also looks at other factors in making its decisions, as noted above, and retains the flexibility to award compensation that it determines to be consistent with the goals of our executive compensation program even if the awards are not deductible by the Company for tax purposes.
Securities Trading Policy
Our insider trading policy prohibits our directors and employeesSection 16 officers from trading in our securities during certain designated blackout periods, and otherwise whileduring any time in which they are aware of material non-public information, and from engaging in hedging transactions or short salesshort-sales and trading in puts and calls with respect to our securities. The policy also cautions against holding our securities in a margin account or pledging our securities as collateral for a loan.
Clawback Provisions
In 2011, based on the Compensation Committee’s recommendation, theOur Board has approved a clawback policy for all Section 16 reporting officers, including the Named Executive Officers.NEOs. The clawback policy authorizes the Board to recoup all performance-based compensation paid during the years affected by a financial statement restatement or executive misconduct. The Board may also direct the Company to cancel any equity-based awards granted to the executives during the applicable time period and recoup any gains realized during the time period with respect to equity-based awards.
StockEquity Ownership Guidelines
In order to further align themanagement's interests of the employees with the interests of the Company, our Board, based upon the recommendation of the Compensation and Human Capital Committee, approved a stockan equity ownership guideline policy. The Board has delegated oversight of the policy wherebyto the Compensation and Human Capital Committee, and has authorized the committee to recommend policy modifications from time to time. Under the current policy, each executive officer is expectedencouraged to acquire and maintain ownership of our common stock, including equity awards subject to vesting conditions, equal in value to a specified multiple of the executive officer’s base salary.
The policy currently recommends the following stockequity holdings for our Named Executive Officers:
| | | | | |
| |
| StockEquity Ownership GuidelineGuidelines |
| Chief Executive Officer | Five (5) times base salary |
Named Executive Officers (excluding Chief Executive Officer)Financial Officer, Chief Banking Officer, and Chief Operating Officer | Three (3) times base salary |
| All other Executive Officers | Two (2) times base salary |
Ownership is measured at the end of each year using the applicable year’s average closing Class A common stock price. Each Named Executive OfficerNEO is expected to meettarget meeting the ownership guidelines by the later of January 1, 2018 orwithin five years from the date he or shethey became a Named Executive Officer.
Equity Granting Practices
The Board of Directors, based on the recommendationNEO. All of the Compensation Committee, adoptedNEOs were in compliance with the 2015 Equity Incentive Plan under whichguidelines, including grace periods, set forth in the Compensation Committee (or a subcommittee thereof) approves equity awards to certain officers, including the Named Executive Officers. Awards are granted to enhance our ability to attract, retain, and motivate employees and directors who are expected to make important contributions to us by providing them with both equity ownership opportunities and performance-based incentives intended to align their interests with those of our shareholders. The Compensation Committee has delegated authority to the Company’s Chief Executive Officer, subject to certain terms and limitations as established by the Committee, to make awards to employees who are not Section 16 officers. For additional information regarding our equity compensation plans, see “Equity Compensation Plans.”
policy.
Results of Shareholder Advisory Approval of Named Executive Officer Compensation
The Company holds non-binding advisory votes on executive compensation every other year with the last vote occurring during the 20172021 Annual Meeting of the Shareholders. At the 2017 Annual Meeting of Shareholders,that meeting, shareholders were asked to approve, on an advisory basis, the Named Executive OfficerNEO compensation for 20162020 as reported in our 2017 joint2021 proxy statement/prospectus.statement. This say-on-pay proposal was approved by over 99%98% of the shares present in person or by proxy and entitled to vote.vote on the matter. The Compensation and Human Capital Committee considered the results of the 20172021 advisory vote, along with shareholder input and other factors discussed in this Compensation Discussion and Analysis and concluded that no changes to our compensation policies and practices were warranted in response to the shareholder advisory vote.
Risk Assessment of Compensation Programs
The Compensation and Human Capital Committee designs our compensation programs to encourage appropriate risk takingmanagement while discouraging behavior that may result in unnecessary or excessive risk. In this regard, the following elements have been incorporated in our compensation programs for executive officers:
|
| | | | | | | |
| þ☑ | Use of multiple metrics in annual short-term incentive plan and use of two long-term incentive vehicles for executive officers; |
| þ☑ | EachCapping each short-term incentive award metric capped at 150%; |
| þ☑ | Performance-basedCapping performance-based share awards capped at 200%; |
| þ☑ | Time-basedProviding time-based share awards that vest ratably over three years; |
| þ☑ | Emphasis onEmphasizing long-term and performance-based compensation; |
| þ☑ | FormalInstituting formal clawback policies applicable to both cash and equity performance-based compensation; and |
| þ☑ | Alignment ofAligning interests of our executive officers with the long-term interests of our shareholders through stockequity ownership guidelines that call for significant share ownership.guidelines. |
The Compensation and Human Capital Committee periodically reviews with management an assessment of whether risks arising from the Company’s compensation policies and practices for all employees are reasonably likely to have a material adverse effect on the Company, as well as the means by which any potential risks may be mitigated, such as through governance and oversight policies. Based on its most recentthe 2021 assessment, the Compensation and Human Capital Committee concluded that our compensation policies and practices for all employees do not create risks that are reasonably likely to have a material adverse effect on the Company.
|
|
| Compensation and Human Capital Committee Report |
The Compensation and Human Capital Committee has reviewed and discussed the foregoing “Compensation Discussion and Analysis” required by Item 402(b) of Regulation S-Kinformation with management and, based on such review and discussions, the Compensation and Human Capital Committee recommended to the Board that the “Compensation Discussion and Analysis” be included in this proxy statement and be incorporated by reference into the Company’s 2018 Form 10-K.2021 Annual Report.
SUBMITTED BY THE COMPENSATION COMMITTEE OF THE BOARD OF DIRECTORS:
Submitted by the Compensation and Human Capital Committee of the Board of Directors: | | | | | | | | | | | | | | |
| Patricia L. Moss, Chair | Stephen B. Bowman | Stephen M. Lacy | Daniel A. Rykhus | James R. Scott |
| | |
Teresa A. Taylor, Chair | Steven J. Corning | Charles E. Hart |
John Heyneman, Jr. | Patricia L. Moss | James R. Scott |
|
|
COMPENSATION OF EXECUTIVE OFFICERS AND DIRECTORS |
|
|
|
2018Compensation of Named Executive Officers2021 Summary Compensation Table |
The table below summarizes the total compensation paid or earned by each of the Named Executive OfficersNEOs for the fiscal years ended December 31, 2018, 20172021, 2020, and 2016.2019, as required by applicable rules of the SEC. When approving total compensation for each of the Named Executive Officers,NEOs, the Compensation and Human Capital Committee considers compensation paid to executives in comparable financial institutions.institutions, including our 2021 Peers.
| | | | | | | | | | | | | | | | | | | | | | | | | | | |
| | | | | | | | | | | |
| Name and Position | | Salary ($) | Short Term Incentive ($) | Equity Awards ($) (1) | | | | | All Other Compensation ($) (2) | Total ($) |
Kevin P. Riley (3) | 2021 | $ | 864,594 | | $ | 649,817 | | $ | 1,442,198 | | | | | | $ | 244,634 | | 3,201,243 | |
| President & Chief | 2020 | $ | 823,423 | | 800,036 | | 943,409 | | | | | | 372,305 | | 2,939,173 | |
| Executive Officer | 2019 | 784,243 | | 531,638 | | 866,261 | | | | | | 349,884 | | 2,532,026 | |
Marcy D. Mutch (4) | 2021 | 463,827 | | 261,454 | | 365,948 | | | | | | 33,069 | | 1,124,298 | |
| Exec. Vice President & | 2020 | 440,385 | | 335,000 | | 368,062 | | | | | | 33,233 | | 1,176,680 | |
| Chief Financial Officer | 2019 | 410,385 | | 186,750 | | 332,153 | | | | | | 42,585 | | 971,873 | |
| Jodi Delahunt Hubbell | 2021 | 442,851 | | 249,630 | | 349,380 | | | | | | 28,931 | | 1,070,792 | |
| Exec. Vice President & | 2020 | 418,933 | | 308,000 | | 351,436 | | | | | | 32,222 | | 1,110,591 | |
| Chief Operating Officer | 2019 | 384,519 | | 173,813 | | 205,616 | | | | | | 156,050 | | 919,998 | |
Russell A. Lee (5) | 2021 | 366,092 | | 205,470 | | 215,688 | | | | | | 23,250 | | 810,500 | |
| Exec. Vice President & | 2020(5) | 358,462 | | 240,000 | | 148,873 | | | | | | 1,225,402 | | 1,972,737 | |
| Chief Banking Officer | 2019 | N/A | N/A | N/A | | | | | N/A | N/A |
Kirk D. Jensen (4) | 2021 | 346,042 | | 161,871 | | 169,913 | | | | | | 29,123 | | 706,949 | |
| Exec. Vice President & | 2020 | 338,242 | | 145,000 | | 175,733 | | | | | | 29,527 | | 688,502 | |
| General Counsel | 2019 | 327,098 | | 147,857 | | 163,970 | | | | | | 39,097 | | 678,022 | |
(1) The amounts reflect the aggregate grant date fair value computed in accordance with FASB ASC Topic 718. Equity awards are a combination of time-based vesting and performance-based vesting restricted equity awards. See 2021 Equity Awards Granted During 2021 table for a breakdown of this by award type.
(2) The amounts shown reflect for each NEO: contributions by us to our employee savings plans, under Section 401(k) of the Code; contributions by us to our non-qualified deferred compensation plan; premiums paid by us for individual long-term care plans; and dividends on unvested restricted stock. The amounts do not reflect premiums paid by us for group health, life and disability insurance policies that apply generally to all salaried employees on a nondiscriminatory basis.
(3) The amounts in the All Other Compensation column for Mr. Riley also reflect income from amounts paid by us for social club dues, the personal use of a Company vehicle, imputable income for Company plane use, and Company contributions to Mr. Riley's non-qualified defined contribution supplemental executive retirement plan of $174,195, $331,800, and $261,332 earned for the performance periods ending in 2021, 2020, and 2019, respectively.
(4) The amounts in the All Other Compensation column for Ms. Mutch and Mr. Jensen also reflect income from amounts paid by us for social club dues.
(5) We have non-competition, consulting and release agreements with Russell A. Lee, our chief banking officer, that were agreed upon in 2018 in connection with our acquisition of Northwest Bancorporation, Inc., where Mr. Lee served as president and chief executive officer. The non-competition agreement restricts for two years following the termination of his employment with us his ability to (i) engage in any business or enterprise that competes directly or indirectly with the Company or First Interstate Bank in Idaho, Montana, Oregon or Washington, and (ii) solicit any employee of First Interstate Bank to leave the employ of First Interstate Bank or divert any business from First Interstate Bank, and in consideration of this arrangement and a full release of legal claims the Bank agreed to pay Mr. Lee $1.2 million in August 2020, which amount is subject to a corresponding pro-rata clapback for any portion of the two-year restriction following any breach by Mr. Lee of the restrictive covenants.
|
| | | | | | | | | | | | | | | | | | | | | | | | |
| | | | | | | Bonus | | Stock | | All Other | | |
| Name and | | | | Salary | (STI) | | Awards | | Compensation | | Total |
| Position | | | | ($) | ($) | | ($)(2) | | ($)(3) | | ($) |
| | | | | | | | | | | | | | | |
| Kevin P. Riley | | 2018 | | $ | 741,106 |
| | $ | 602,064 |
| | | $ | 792,989 |
| | $ | 361,918 |
| (4) | | $ | 2,498,077 |
|
| President & | | 2017 | | 660,616 |
| | 406,800 |
| | | 474,560 |
| | 254,064 |
| | | 1,796,040 |
|
| Chief Executive Officer | | 2016 | | 560,384 |
| | 300,000 |
| | | 299,938 |
| | 252,492 |
| | | 1,412,814 |
|
| | | | | | | | | | | | | | | |
| Marcy D. Mutch | | 2018 | | 379,616 |
| | 225,000 |
| | | 192,984 |
| | 29,819 |
| (5) | | 827,419 |
|
| Exec. Vice President & | | 2017 | | 342,769 |
| | 175,000 |
| | | 182,427 |
| | 25,106 |
| | | 725,302 |
|
| Chief Financial Officer | | 2016 | | 278,615 |
| | 123,000 |
| | | 119,944 |
| | 5,582 |
| | | 527,141 |
|
| | | | | | | | | | | | | | | |
Jodi Delahunt Hubbell (1) | | 2018 | | 363,462 |
| | 200,000 |
| | | 187,925 |
| | 22,706 |
| | | 774,093 |
|
| Exec. Vice President & | | 2017 | | N/A |
| | N/A |
| | | N/A |
| | N/A |
| | | N/A |
|
| Chief Operating Officer | | 2016 | | N/A |
| | N/A |
| | | N/A |
| | N/A |
| | | N/A |
|
| | | | | | | | | | | | | | | |
| Kirk D. Jensen | | 2018 | | 314,539 |
| | 160,000 |
| | | 159,936 |
| | 26,302 |
| (5) | | 660,777 |
|
| Exec. Vice President & | | 2017 | | 283,846 |
| | 135,000 |
| | | 149,940 |
| | 21,933 |
| | | 590,719 |
|
| General Counsel | | 2016 | | 250,000 |
| | 118,000 |
| | | 162,371 |
| | 70,255 |
| | | 600,626 |
|
| | | | | | | | | | | | | | | |
| Philip Gaglia | | 2018 | | 253,508 |
| | 150,000 |
| | | 129,989 |
| | 23,108 |
| (5) | | 556,605 |
|
| Exec. Vice President & | | 2017 | | N/A |
| | N/A |
| | | N/A |
| | N/A |
| | | N/A |
|
| Chief Risk Officer | | 2016 | | N/A |
| | N/A |
| | | N/A |
| | N/A |
| | | N/A |
|
| | | | | | | | | | | | | | | |
| William D. Gottwals | | 2018 | | 350,000 |
| | 112,000 |
| | | 149,981 |
| | 26,389 |
| | | 638,370 |
|
| Exec. Vice President & | | 2017 | | 342,308 |
| | 100,000 |
| | | 139,944 |
| | 22,852 |
| | | 605,104 |
|
| Director of Banking | | 2016 | | 300,012 |
| | 93,000 |
| | | 140,065 |
| | 10,696 |
| | | 543,773 |
|
| | | | | | | | | | | | | | | |
| Stephen W. Yose | | 2018 | | 331,231 |
| | 169,680 |
| | | 129,989 |
| | 28,922 |
| | | 659,822 |
|
| Exec. Vice President & | | 2017 | | 298,846 |
| | 100,000 |
| | | 164,934 |
| | 22,842 |
| | | 586,622 |
|
| Chief Credit Officer | | 2016 | | 198,750 |
| | 160,000 |
| | | 200,010 |
| | 142,956 |
| | | 701,716 |
|
| | | | | | | | | | | | | | | |
| |
(1)
| Ms. Delahunt Hubbell joined the Company as Executive Vice President and Chief Banking Officer on October 16, 2017. She assumed the role of Executive Vice President and Chief Operating Officer on February 24, 2018.
|
| |
(2)
| The amounts reflect the aggregate grant date fair value computed in accordance with FASB ASC Topic 718. Stock awards are a combination of time-based vesting and performance-based vesting restricted stock awards. The above table includes the value of the 2016 performance awards based on return on average assets, return on average equity and total shareholder return performance at the 50th to 100th percentile, the value of the 2017 and 2018 performance awards based on return on average equity and total shareholder return performance at the 50th and 100th percentile, which would entitle the Named Executive Officers to receive 100% of the performance based vesting restricted stock awarded, or the target shares. The maximum vesting for the performance awards is 150% of target shares for 2016, if return on average assets, return on average equity and total shareholder return performance are at or above the 75% percentile of the SNL Index for 2016, and 150% of target shares for 2017 and 2018, if return on average equity and total shareholder return performance are at or above the 75% percentile of the SNL Index for 2017. The 2016 performance based restricted stock awards are scheduled to vest at 115.50% of target on March 15, 2019. |
Time and performance stockequity awards are presented below for each NEO included in the 20182021 Summary Compensation table above. |
| | | | | | |
| | | | | Time Restricted | | Performance Restricted |
| | | | | Stock Awards | | Stock Awards |
| | | | | (#) | | (#) |
| | | | | | | |
| Kevin P. Riley | | 2018 | | 9,718 | | 9,718 |
| | | 2017 | | 5,697 | | 5,697 |
| | | 2016 | | 5,724 | | 5,724 |
| | | | | | | |
| Marcy D. Mutch | | 2018 | | 2,365 | | 2,365 |
| | | 2017 | | 2,190 | | 2,190 |
| | | 2016 | | 2,289 | | 2,289 |
| | | | | | | |
| Jodi Delahunt Hubbell | | 2018 | | 2,303 | | 2,303 |
| | | 2017 | | 5,215 | | N/A |
| | | 2016 | | N/A | | N/A |
| | | | | | | |
| Kirk D. Jensen | | 2018 | | 1,960 | | 1,960 |
| | | 2017 | | 1,800 | | 1,800 |
| | | 2016 | | 1,908 | | 1,908 |
| | | | | | | |
| Philip Gaglia | | 2018 | | 1,593 | | 1,593 |
| | | 2017 | | 1,470 | | 1,470 |
| | | 2016 | | 1,431 | | 1,431 |
| | | | | | | |
| William D. Gottwals | | 2018 | | 1,838 | | 1,838 |
| | | 2017 | | 1,680 | | 1,680 |
| | | 2016 | | 2,673 | | 2,673 |
| | | | | | | |
| Stephen W. Yose | | 2018 | | 1,593 | | 1,593 |
| | | 2017 | | 1,980 | | 1,980 |
| | | 2016 | | 7,080 | | N/A |
| | | | | | | |
| | | | | | | | | | | | | | | | | |
| | | | Time-Based Vesting Restricted | Performance-Based Restricted |
| | Equity Awards (#) | Equity Awards (1) (#) |
| Kevin P. Riley | 2021 | 11,594 | | 17,392 | |
| 2020 | 12,869 | | 19,304 | |
| 2019 | 8,235(3) | 12,353 | |
| Marcy D. Mutch | 2021 | 2,942 | | 4,413 | |
| 2020 | 5,021 | | 7,531 | |
| 2019 | 3,182 | | 4,773 | |
| Jodi Delahunt Hubbell | 2021 | 2,809 | | 4,213 | |
| 2020 | 4,794 | | 7,191 | |
| 2019 | 2,044 | | 3,066 | |
| Russell A. Lee | 2021 | 1,734 | | 2,601 | |
| 2020 | 2,031 | | 3,046 | |
| 2019 | N/A | N/A |
| Kirk D. Jensen | 2021 | 1,366 | | 2,049 | |
| 2020 | 2,397 | | 3,596 | |
| 2019 | 1,630 | | 2,445 | |
(1) The 2016, 2017,number of shares listed assumes target level performance. The 2019*, 2020, and 2018 time2021 time-based vesting awards and the portion of the performance-based vesting awards that vests based on return on adjusted average equity (“ROAE”) were valued at $26.20$40.31 per share, $41.65$28.36 per share, and $40.80$50.82 respectively, for all executive officers other than with respect to the 2019 performance-based vesting awards for Ms. Mutch and Mr. Riley, which were valued at $41.73 and $42.19, respectively. The portions of the 2019, 2020, and 2021 performance-based vesting awards which vest based on total shareholder return (“TSR”) were valued based on Monte Carlo at $40.07 per share, respectively. Additional time-based$31.57 per share, and $47.27 respectively, for all executive officers other than with respect to the 2019 performance-based vesting restricted stock awards for Ms. Mutch and Mr. Riley, which were valued at $44.07 per share, were awarded to Ms. Delahunt Hubbell upon her employment with the Company in October 2017. $41.81.
| |
(3)
| The amounts shown reflect for each Named Executive Officer: contributions by us to our qualified profit sharing and employee savings plans, under Section 401(k) of the Internal Revenue Code; contributions by us to our nonqualified deferred compensation plan; premiums paid by us for individual long-term care plans; and dividends on unvested restricted stock. The amounts do not reflect premiums paid by us for group health, life and disability insurance policies that apply generally to all salaried employees on a nondiscriminatory basis.
|
| |
(4)
| The amounts in the All Other Compensation column for Mr. Riley also reflect income from amounts paid by us for social club dues, the personal use of a Company vehicle, Company contributions to Mr. Riley's non-qualified defined contribution supplemental executive retirement plan of $301,032, $208,282 and $201,140 in 2018, 2017, and 2016 respectively, and relocation costs of $80,645 paid in 2016. |
| |
(5)
| The amounts in the All Other Compensation column for Ms. Mutch, Mr. Jensen, Mr. Gaglia, and Mr. Gottwals also reflect income from amounts paid by us for social club dues. |
|
|
| Equity Compensation Plans |
The Company has equity awards outstanding under two stock-basedequity-based compensation plans;plans: the 2015 Equity Incentive Plan, as amended (the “2015 Plan”) and the 2006 Equity Compensation Plan, as amended and restated, (the “2006 Plan”). These plans were primarily established to enhance the Company’s ability to attract, retain, and motivate employees.
The 2015 Plan, approved by the Company’s shareholders in May 2015, was established to provide us with flexibility to select from various equity-based performance compensation methods, and to be able to address changing accounting and tax rules and corporate governance practices by optimally utilizing performance basedequity-based compensation. The 2015 Plan did not increase the number of shares of common stock available for awards under the 2006 Plan.
The 2006 Plan, which was approved by the Company’s shareholders in May 2006 and May 2014, was established to consolidate into one plan the benefits available under all other then-existing share-based award plans (collectively with theplans. The 2006 Plan the “Previous Plans”). The Previous Plans continuecontinues to govern outstanding awards made prior to May 2015.
The 2015 Plan contains the following important features:
|
| | | | |
þ☑ | The maximum number of shares of our Class A Common Stock reserved for issuance under the 2015 Plan was 2,000,000, which was approximately 9.2% of our previously-existingpreviously existing Class A Common Stock outstanding at the time of shareholder approval. |
þ☑ | The 2015 Plan prohibits the repricing of awards without shareholder approval. |
þ☑ | The 2015 Plan prohibits the recycling of shares. |
þ☑ | Awards under the 2015 Plan are subject to broad discretion by the Compensation and Human Capital Committee administering the plan. |
þ☑ | All awards under the 2015 Plan are based on the closing price of the underlying common stock as quoted on NASDAQ Stock Market for the last market trading day prior to the date of the award. |
The following terms apply to equity awards granted for each of the last three years:
Time-restricted•Time restricted awards - three-year graded vesting period; and
| |
• | Performance-restricted awards - cliff vesting as of March 15thof the third year following the year of the award for 2018, 2017, and 2016,•Performance restricted awards - cliff vesting as of March 15of the third year following the year of the award for 2021, 2020, and 2019 respectively, based on achievement of specified performance conditions.
2021 Equity Awards Granted During 2021 | | | | | | | | | | | | | | | | | | | | | | | | | | | | Estimated Future Payouts Under Equity Incentive Plan Awards | All Other Equity Awards | | | Name | Grant Date | Committee Approval Date | Threshold (#)(1) | Target (#)(2) | Maximum (#)(3) | Number of Stock or Units (#)(4) | Grant Date Fair Value of Equity Awards ($)(5) | | | Kevin P. Riley | 3/15/2021 | 2/17/2021 | — | | — | | — | | 11,594 | | $ | 589,207 | | | | 3/15/2021 | 2/17/2021 | 8,696 | | 17,392 | | 34,784 | | — | | 852,911 | | | | Marcy D. Mutch | 3/15/2021 | 2/17/2021 | — | | — | | — | | 2,942 | | 149,512 | | | | 3/15/2021 | 2/17/2021 | 2,207 | | 4,413 | | 8,826 | | — | | 216,436 | | | | Jodi Delahunt Hubbell | 3/15/2021 | 2/17/2021 | — | | — | | — | | 2,809 | | 142,753 | | | | 3/15/2021 | 2/17/2021 | 2,107 | | 4,213 | | 8,426 | | — | | 206,627 | | | | Russell A. Lee | 3/15/2021 | 2/17/2021 | — | | — | | — | | 1,734 | | 88,122 | | | | 3/15/2021 | 2/17/2021 | 1,301 | | 2,601 | | 5,202 | | — | | 127,566 | | | | Kirk D. Jensen | 3/15/2021 | 2/17/2021 | — | | — | | — | | 1,366 | | 69,420 | | | | 3/15/2021 | 2/17/2021 | 1,025 | | 2,049 | | 4,098 | | — | | 100,493 | | |
(1) This represents the threshold payout of 50% of target on the performance shares awarded, one half of which is based on TSR and one half on ROAE. In order to receive this threshold payout, the Company’s future three-year TSR/ROAE must be at the 35th percentile or above when compared to the comparator group. (2) This represents the target payout of 100% of target on the performance restricted equity awarded, one half of which is based on TSR and one half on ROAE. In order to receive this threshold payout, the Company’s future three-year TSR/ROAE must be at the 50th percentile or above when compared to the comparator group. Dividends are accrued on performance-restricted equity and payable upon vesting at the same rate as dividends are paid to other shareholders. (3) This represents the maximum payout of 200% of target on the performance-based vesting restricted equity awarded, one half of which is based on TSR and one half on ROAE. In order to receive this maximum payout, the Company’s future three-year TSR/ROAE must be at the 90th percentile or above when compared to the comparator group. (4) This represents the shares of time restricted equity that vest at a rate of one-third (1/3) each year through March 15, 2024, contingent on continued employment. Dividends are paid out on these shares at the same time and same rate as dividends are paid to other shareholders. (5) The dollar value of stock awards shown represents the grant date fair value calculated on the basis of the fair value of the underlying shares of common stock at target on the grant date in accordance with FASB ASC Topic 718. The fair value for time-based vesting restricted equity is the fair market value on the date of grant of $50.82. The value shown for the performance-based vesting restricted equity represents the number of awards that could be earned at target multiplied by the fair value, which is the fair market value on the date of grant of $50.82 for the portion that vests based on ROAE and the Monte Carlo fair value of $47.27 for the portion that vests based on TSR.
|
|
|
2018 Grants of Plan-Based Awards |
Equity Awards Outstanding as of December 31, 2021 | | | | | | | | | | | | | | | | | | | | | |
| | Equity Awards |
| | | | | | | | | | Equity Incentive Plan Awards |
| | | | | | | | | Market Value | Number of | Market Value or Payout |
| | | | | | | | Number of Shares or | of Shares or | Unearned Shares, | Value of Unearned Shares, |
| | | | | | | | Units of Stock That | Units of Stock That | Units, or Other Rights | Units, or Other Rights That |
| Name | | | | | | | | Have Not Vested (#)(1) | Have Not Vested ($)(3) | Have Not Vested (#)(2) | Have Not Vested ($)(3) |
| Kevin P. Riley | | | | | | | | 22,919 | | $ | 932,116 | | 49,049 | | $ | 1,994,823 | |
| Marcy D. Mutch | | | | | | | | 7,351 | | 298,965 | | 16,717 | | 679,880 | |
| Jodi Delahunt Hubbell | | | | | | | | 6,687 | | 271,960 | | 14,470 | | 588,495 | |
| Russell A. Lee | | | | | | | | 3,088 | | 125,589 | | 5,647 | | 229,663 | |
| Kirk D. Jensen | | | | | | | | 3,508 | | 142,670 | | 8,090 | | 329,020 | |
(1) Represents unvested time-based vesting restricted stock, which at original issuance vested at a rate of one-third each year, contingent on continued employment.
(2) Represents the target number of performance-based vesting restricted stock shares that are expected to vest March 15, 2022, March 15, 2023, and March 15, 2024 based upon achievement of specified performance conditions and continued employment. |
| | | | | | | | | | |
| | | | | | Estimated Future Payouts Under | | | |
| | | | | | Equity Incentive Plan Awards | | All Other Stock Awards: | |
| | | | Committee | | | | | | Number of | Grant Date |
| | | Grant | Approval | | Threshold | Target | Maximum | | Stock or Units | Fair Value of |
| Name | | Date | Date | | (#)(1) | (#)(2) | (#)(3) | | (#) (4) | Stock Awards |
| | | | | | | | | | | |
| Kevin P. Riley | | 2/15/2018 | 1/18/2018 | | — | — | — | | 9,718 | $396,494 |
| | | 2/15/2018 | 1/18/2018 | | 4,859 | 9,718 | 14,577 | | — | $396,494 |
| | | | | | | | | | | |
| Marcy D. Mutch | | 2/15/2018 | 1/18/2018 | | — | — | — | | 2,365 | 96,492 |
| | | 2/15/2018 | 1/18/2018 | | 1,183 | 2,365 | 3,548 | | — | 96,492 |
| | | | | | | | | | | |
| Jodi Delahunt Hubbell | | 2/15/2018 | 1/18/2018 | | — | — | — | | 2,303 | 93,962 |
| | | 2/15/2018 | 1/18/2018 | | 1,152 | 2,303 | 3,455 | | — | 93,962 |
| | | | | | | | | | | |
| Kirk D. Jensen | | 2/15/2018 | 1/18/2018 | | — | — | — | | 1,960 | 79,968 |
| | | 2/15/2018 | 1/18/2018 | | 980 | 1,960 | 2,940 | | — | 79,968 |
| | | | | | | | | | | |
| Philip Gaglia | | 2/15/2018 | 1/18/2018 | | — | — | — | | 1,593 | 64,994 |
| | | 2/15/2018 | 1/18/2018 | | 797 | 1,593 | 2,390 | | — | 64,994 |
| | | | | | | | | | | |
| William D. Gottwals | | 2/15/2018 | 1/18/2018 | | — | — | — | | 1,838 | 74,990 |
| | | 2/15/2018 | 1/18/2018 | | 919 | 1,838 | 2,757 | | — | 74,990 |
| | | | | | | | | | | |
| Stephen W. Yose | | 2/15/2018 | 1/18/2018 | | — | — | — | | 1,593 | 64,994 |
| | | 2/15/2018 | 1/18/2018 | | 797 | 1,593 | 2,390 | | — | 64,994 |
| | | | | | | | | | | |
| |
(1) (3) Market value is based on closing price of the common stock on 12/31/2021 of $40.67 per share.
| This represents the threshold payout of 50% of target on the performance shares awarded, one half of which is based on total stockholder return (“TSR”) and one half on return on average equity (“ROAE”). In order to receive this threshold payout, the Company’s future three-year TSR/ROAE must be at the 35th percentile or above when compared to the SNL Index.
|
| |
(2)
| This represents the target payout of 100% of target on the performance based vesting restricted stock awarded, one half of which is based on TSR and one half on ROAE. In order to receive this threshold payout, the Company’s future three-year TSR/ROAE must be at the 50th percentile or above when compared to the SNL Index. Dividends are paid on performance based vesting restricted stock that vest at the same rate as dividends are paid to other shareholders.
|
| |
(3)
| This represents the maximum payout of 150% of target on the performance based vesting restricted stock awarded, one half of which is based on TSR and one half on ROAE. In order to receive this maximum payout, the Company’s future three-year TSR/ROAE must be at the 76th percentile or above when compared to the SNL Index.
|
| |
(4)
| This represents the shares of time based restricted stock that vest at a rate of 33% each year through February 15, 2021, contingent on continued employment. Dividends are paid out on these shares at the same time and same rate as dividends are paid to other shareholders. |
Equity Awards Vested During 2021 | | | | | | | | | | | | |
| | | Equity Awards |
| Name | | | | | Number of Shares Acquired on Vesting (#) | Value Realized on Vesting ($)(1) |
| Kevin P. Riley | | | | | 21,363 | | $ | 1,003,101 | |
| Marcy D. Mutch | | | | | 6,220 | | 289,155 |
| Jodi Delahunt Hubbell | | | | | 5,674 | | 264,682 |
| Russell A. Lee | | | | | 677 | | 29,862 |
| Kirk D. Jensen | | | | | 4,230 | | 198,839 |
(1) The amount in the Value Realized on Vesting column reflects the closing price of the common stock as reported on the NASDAQ Stock Market on the day prior to vesting multiplied by the number of shares vesting. |
|
Outstanding Equity Awards at 2018 Fiscal Year-End |
|
| | | | | | | | |
| | | Stock Awards |
| | | | | | | Equity Incentive Plan Awards |
| | | | | Market Value | | Number of | | Market Value or Payout |
| | | Number of Shares or | | of Shares or | | Unearned Shares, | | Value of Unearned Shares, |
| | | Units of Stock | | Units of Stock | | Units, or Other Rights | | Units, or Other Rights |
| | | That Have Not Vested | | That Have Not Vested | | That Have Not Vested | | That Have Not Vested |
| Name | | (#)(1) | | ($) | | (#)(2) | | ($) |
| | | | | | | | | |
| Kevin P. Riley | | 15,424 | | $563,901 | | 21,139 | | $772,842 |
| | | | | | | | | |
| Marcy D. Mutch | | 4,588 | | 167,737 | | 6,844 | | 250,217 |
| | | | | | | | | |
| Jodi Delahunt Hubbell | | 5,779 | | 211,280 | | 2,303 | | 84,198 |
| | | | | | | | | |
| Kirk D. Jensen | | 3,796 | | 138,782 | | 5,668 | | 207,222 |
| | | | | | | | | |
| Philip Gaglia | | 3,050 | | 111,508 | | 4,494 | | 164,301 |
| | | | | | | | | |
| William D. Gottwals | | 3,849 | | 140,719 | | 6,191 | | 226,343 |
| | | | | | | | | |
| Stephen W. Yose | | 5,273 | | 192,781 | | 3,573 | | 130,629 |
| | | | | | | | | |
| |
(1)
| Represents unvested time-based vesting restricted stock, which at original issuance vested at a rate of one-third each year, contingent on continued employment. |
| |
(2)
| Represents the threshold number of performance-based vesting restricted stock shares that are expected to vest March 15, 2019, March 15, 2020, and March 15, 2021 based upon achievement of specified performance conditions and continued employment.
|
|
| | | | |
| | | Stock Awards |
| | | Number of Shares | | |
| Name | | Acquired on Vesting (#) | | Value Realized on Vesting ($)(1) |
| | | | | |
| Kevin P. Riley | | 8,400 | | $360,394 |
| Marcy D. Mutch | | 2,223 | | 93,648 |
| Jodi Delahunt Hubbell | | 1,739 | | 76,638 |
| Kirk D. Jensen | | 1,236 | | 50,429 |
| Philip Gaglia | | 1,339 | | 54,631 |
| William D. Gottwals | | 1,451 | | 59,201 |
| Stephen W. Yose | | 3,020 | | 120,738 |
| | | | | |
| |
(1)
| The amount in the Value Realized on Vesting column reflects the closing price of the common stock as reported on the Nasdaq Stock Market on the day prior to vesting multiplied by the number of shares vesting. |
|
|
2018 Non-Qualified Deferred Compensation |
The Company has a non-qualified deferred compensation plan (the “Deferred Compensation Plan”) established for the benefit of a select group of management and highly-compensatedhighly compensated employees, including Named Executive Officers.NEOs. Under the terms of our Deferred Compensation Plan, eligible employees, as determined by our Board or Compensation and Human Capital Committee, may defer a portion of base salary, or short-term incentives and, if applicable, supplemental executive retirement plan contributions, subject to certain maximums as set forth by the plan administrator. Deferral elections generally are made by eligible executivesemployees during the last quarter of each year for amounts to be earned in the following year.year; eligible employees are permitted, however, to change the time and/or form of a scheduled distribution in accordance with procedures established by the plan administrator, provided that any subsequent election to delay a payment must be made at least 12 months prior to the date the first scheduled distribution payment would have been made and the first payment must be deferred for at least five years from the date the first scheduled distribution payment would have been made. We make discretionary contributions to the Deferred Compensation Plan on behalf of the executive officer participants for 401(k) plan matching contributions and profit sharingprofit-sharing contributions in excess of Code limitations. Other contributions on behalf of a participant may be made at the discretion of our Board.
The deferral account of each participant is adjusted by investment earnings or losses based upon the performance of the underlying investments selected by the participant from among alternatives selected by the plan administrator. Benefits under the Deferred Compensation Plan are generally not paid until the beginning of the year following the participant’s retirement or termination from the Company. Benefits can be received either as a lump sum payment or in annual or monthly installments over a period not to exceed ten years or, for contributions made after 2016, 15 years, based on the executive’semployee’s election made at least one year prior to retirement. The distribution elections are all made in accordance with Section 409A.409A of the Code.
The following table shows the contributions, earnings, and aggregate balance of total deferrals byfor each of our Named Executive OfficersNEOs as of December 31, 2018.2021.
| | | | | | | | | | | | | | | | | |
| Name | Executive Contributions in Last Fiscal Year ($)(1) | Registrant Contributions in Last Fiscal Year ($)(2) | Aggregate Earnings in Last Fiscal Year ($) | Aggregate Withdrawals/Distributions ($) | Aggregate Balance at Last Fiscal Year End ($) |
| Kevin P. Riley | $ | 400,018 | | $ | 331,800 | | $ | 244,993 | | $ | — | | $ | 3,265,650 | |
| Marcy D. Mutch | 83,750 | | — | | 25,282 | | — | | 303,246 | |
| Jodi Delahunt Hubbell | 61,600 | | — | | 31,108 | | — | | 191,984 | |
| Russell A. Lee | — | | — | | — | | — | | — | |
| Kirk D. Jensen | — | | — | | — | | — | | 1,150 | |
|
| | | | | | | | | | |
| | | Executive Contributions in Last Fiscal Year | | Registrant Contributions in Last Fiscal Year | | Aggregate Earnings In Last Fiscal Year | | Aggregate Withdrawals/Distributions | | Aggregate Balance At Last Fiscal Year End |
| Name | ($)(1) | | ($)(2) | | ($) | | ($) | | ($) |
| | | | | | | | | | | |
| Kevin P. Riley | | $203,400 | | $214,556 | | $(63,253) | | $— | | $876,089 |
| Marcy D. Mutch | | 43,750 | | 1,169 | | (3,196) | | — | | 69,698 |
| Jodi Delahunt Hubbell | | — | | — | | — | | — | | — |
| Kirk D. Jensen | | — | | 222 | | (3) | | — | | 219 |
| Philip Gaglia | | — | | — | | (454) | | 2,492 | | 6,423 |
| William D. Gottwals | | 92,885 | | 6,491 | | (31,647) | | — | | 342,523 |
| Stephen W. Yose | | 36,662 | | 2,053 | | (2,931) | | — | | 140,770 |
| | | | | | | | | | | |
| |
(1)
| The amounts in this column are included as salary and/or short-term incentives for each of the Named Executive Officers in the summary compensation table(1) The amounts in this column are included as salary and/or short-term incentives for each of the NEOs in the year the contribution was earned.
|
| |
(2)
| The amounts in this column are included as other compensation for each of the Named Executive Officers in the summary compensation table in the year the contribution was earned.
|
(2) The amounts in this column are included as other compensation for each of the NEOs in the year the contribution was paid. |
|
2018The Chief Executive Officer participates in a supplemental executive retirement plan, or SERP, which was implemented in 2015. This benefit is intended to be part of a competitive retirement and benefit package necessary to attract and retain executive talent. Consistent with this objective, the SERP consists of a Base Contribution and a Performance Contingent Contribution. The amount of the base contribution is 20% of the Participant's annualized base salary as of the last day of the Performance Period (the "Base Contribution"). The amount of the performance-contingent contribution, if earned, will be up to an additional 20% of the Participant's annualized base salary as of the last day of the Performance Period (the "Performance-Contingent Contribution").The Performance-Contingent Contribution is based on Company's Total Shareholder Return compared to the established peer group for the measurement period. The Performance-Contingent Contribution amounts fund based on the following scale, interpolated on a linear basis between funding tiers: 0% if below the 35th percentile; 10% if greater than or equal to the 50th percentile; and 20% if greater than or equal to the 75th percentile. The SERP Contributions vested 50% on December 31, 2019, and will vest at 10% on each December 31st thereafter, so long as Participant remains employed by the employer on each such date. Vesting will be accelerated in the event of death, disability, and certain terminations of service in connection with a Change in Control, each as more fully described in the Deferred Compensation Plan. 2021 Other Compensation |
We provide our Named Executive OfficersNEOS with other compensation that the Compensation and Human Capital Committee believes is reasonable and consistent with the overall compensation program to better enable us to attract and retain superiortalented employees for key positions. The Compensation and Human Capital Committee annually reviews the levels of other compensation provided to Named Executive Officers.
NEOs.
The Named Executive OfficersNEOs participate in the following plans and programs along withour health and group life and disability insurance.insurance plans. Additional benefits offered to the Named Executive OfficersNEOs may include some or all of the following:
individual▪Individual life insurance, as described below under “Survivor Income Benefits;”
payment▪Payment of social club dues;
dividends▪Dividends accrued on unvested restricted stock;performance equity awards;
use▪Use of a Company automobile;automobile and airplane; and
long-term▪Long-term care insuranceinsurance.
We obtained life insurance policies on selected officers of First Interstate Bank. Under these policies, we receive all benefits payable upon death of the insured. A survivor income agreement was executed with each of the insured officersMr. Riley, Ms. Mutch, Ms. Delahunt Hubbell, and Mr. Jensen whereby a survivor benefit of $150,000 is payable to designated beneficiaries if the participant is employed by us at the time of death. We have entered into this type of survivor income agreement with Mr. Riley.
|
|
Retirement and Related Plan |
Principal Executive Officer Pay Ratio
We maintain a profit sharing plan for all non-temporary employees. Contributions are made as authorized by the Board. Participants vest after three years of service. In addition, employees are permittedrequired to defer a portion of their compensation into our profit sharing plan under a 401(k) feature, and we make limited matching contributions with respect to such deferrals.
|
|
Chief Executive Officer Total Compensation |
The Outside Members of the Compensation Committee reviewed all components of the Chief Executive Officer’s total compensation package. Mr. Riley was appointed as the Company’s President and Chief Executive Officer on September 23, 2015. The compensation paid to Mr. Riley during his tenure as Chief Executive Officer was determined to be low as compared to that of our peers’ Chief Executive Officer total compensation data. Mr. Riley’s compensation package was larger than those granted to our other executives in recognition of the increased level of responsibility and performance required of our chief executive officer.
As part of its role, the Compensation Committee reviews and considers the deductibility of executive compensation under Section 162(m) of the Code, which provided that we may not deduct compensation of more than $1,000,000 that is paid to certain individuals with certain exceptions. We believe that performance-based compensation paid in 2017 and prior periods under the management incentive plans is generally fully deductible for federal income tax purposes. As discussed above, however, the exemption from the Section 162(m) deduction limit for performance-based compensation has been repealed, effective for taxable years beginning after December 31, 2017, such that compensation paid to our Named Executive Officers in excess of $1 million will not be deductible unless it qualifies for transition relief applicable to certain arrangements in place as of November 2, 2017.
Despite the Compensation Committee’s efforts to structure the executive team annual incentives in a manner intended to be exempt from Section 162(m) and therefore not subject to its deduction limits, because of ambiguities and uncertainties as to the application and interpretation of Section 162(m) and the regulations issued thereunder, including the uncertain scope of the transition relief under the legislation repealing the Section 162(m) exemption from the deduction limit, no assurance can be given that compensation intended to satisfy the requirements for exemption from Section 162(m) in fact will. Further, the Compensation Committee reserves the right to modify compensation that was initially intended to be exempt from Section 162(m) if it determines that such modifications are consistent with the Company’s business needs.
|
|
Chief Executive Officer Pay Ratio |
In August 2015 pursuant to a mandate of the Dodd-Frank Wall Street Reform and Consumer Protection Act (the “Dodd-Frank Act”), the SEC adopted a rule requiringprovide annual disclosure of the ratio of the median employee’s annual total compensation to the total annual compensation of the principal executive officer (“PEO”). The Company’s PEO is Mr. Riley, our Chief Executive Officer. Registrants must comply withOfficer, and the pay ratio ruleoutside members of the Compensation and Human Capital Committee reviewed, approved, and recommended to the Board for the first fiscal year beginning on or after January 1, 2017.approval all components of Mr. Riley's total compensation package. The purpose of the new requiredthis disclosure is to provide a measure of the equitability of pay within the organization.
In determining the median employee, a listing was prepared of all employees other than the PEO as of December 14, 2018.31, 2021. Wages and benefits were annualized for those employees not employed for the full year of 2018. There were 114 employees acquired through the INB acquisition who were excluded from the list since we just completed the integration in November and the Company was not responsible for setting their compensation for most of 2018.2021. The median amount was selected from the resulting list.
list, and such median employee will be used for this purpose for three years unless circumstances change and a new median employee is determined to be needed for this analysis, as permitted by applicable SEC disclosure rules.
For purposes of determining total compensation, the following earnings were included:
▪Base Salary;
Base Salary▪Short-Term Incentive;
Short-Term Incentive
▪Long-Term Incentive comprised of stockequity awards granted during the year; and
▪Other Compensation comprised of:
| |
◦ | Contributions by us to our qualified profit sharing and employee savings plans, under Section 401(k) of the Internal Revenue Code |
| |
◦ | Contributions by us to our nonqualified deferred compensation plan |
| |
◦ | Premiums paid by us for individual long-term care plans |
| |
◦ | Dividends on unvested restricted stock |
| |
◦ | Amounts paid by us for social club dues, signing bonuses, and moving/relocation expenses |
–Contributions by us to our qualified profit sharing and employee savings plans, under Section 401(k) of the Code; |
| | |
| Median Employee Total Annual Compensation | PEO Total Annual Compensation | Ratio of PEO to Median Employee Total Annual Compensation |
| $45,359 | $2,153,096 | 47.5:1 |
–Premiums paid by us for individual long-term care plans;
–Dividends on unvested restricted stock; and –Amounts paid by us for social club dues, signing bonuses, and moving/relocation expenses. | | | | | | | | | | | | | | |
| Median Employee Total Annual Compensation | | PEO Total Annual Compensation | | Ratio of PEO to Median Employee Total Annual Compensation |
| $56,252 | | $2,946,125 | | 52.1 |
Effective in April 2018, theNEO Agreements
The Company entered intohas Executive Employment Agreements with each of Mr. Riley, Ms. Mutch, Ms. Delahunt Hubbell, Mr. Lee, and Mr. Gaglia.
Jensen.
The original termterms of the employment agreements isare for three years,one year, commencing onin August 2021 for Mr. Riley and December 2021 for the effective date.NEOs. After the initial term,expiration of the agreementoriginal terms, the employment agreements automatically renewsrenew for an additional one yearone-year period on each anniversary of the effective date, unless the Company gives the executive notice of termination 90 days prior to expiration.
The employment agreements outline the duties of each employee and forms of remuneration awarded for the performance of such duties, including base salary, bonuses, and various other employer provided benefits. In addition, the employment agreements outline specific duties and payments to be made upon termination of employment under various conditions.
Mr. Riley’s employment agreement also provides for the establishment of a non-qualified defined contribution supplemental executive retirement plan, as discussed above under the heading "2021 Non-Qualified Deferred Compensation."
Payments Made Upon Termination Following a Change in Control |
|
Potential Payments upon Termination or Change of Control |
TerminationThe employment agreements define payments in connection with a change in control: In the event of an involuntary termination of employment without cause (as defined in each executive’s agreement) or voluntary termination by the executive for good reason (as defined in each executive’s agreement) within 6six months preceding or 18 months after a change in control (as defined in each executive’s agreement), Mr. Riley will.
The executive employment agreements provide that the executives shall receive an amount equal to 2two times histheir base salary (three times in the case of Mr. Riley) plus an amount equal to 2two times the average of the annual short-term incentive compensation paid to Executive during eachthe executives (three times in the case of the three years immediately prior to the year in which the Event of Termination occurs; Ms. Mutch, Ms. Delahunt Hubbell, and Mr. Gaglia shall receive an amount equal to 1.5 times the Executive’s base salary plus an amount equal to 1.5 times the average of the annual incentive compensation paid to ExecutiveRiley) during each of the three years immediately prior to the year in which the Event of Termination occurs (the(with respect to each executive, the “Change in Control Payment”). In addition, all
All outstanding unvested restricted stock will fully vest upon termination and the Company will provide certain employment benefits for a period of 1824 months following the date of termination. The benefits may be limited, however, if the executive is initially determined to be subject to excise taxes under Section 4999 and 280G of the Internal Revenue Code but would be better off on a net-after tax basis by reducing the applicable Change in Control PaymentsPayment to avoid being subject to the excise tax.
|
|
Payments Made upon Termination |
Involuntary or good reason termination unrelatedPayments Made Upon Termination Not Related to a changeChange in control: InControl
The employment agreements define payments in the event of an involuntary termination by the Company without cause or voluntary termination by the executive for good reason, reason.
Mr. Riley’s executive employment agreement indicates he shall receive an amount equal to 2two times the sum of his base salary, plus two times his average annual short-term incentive compensation paid during the three years prior to termination, as well as 24 months of continuing medical, dental, and vision benefits after termination.
Ms. Mutch, Ms. Delahunt Hubbell, Mr. Lee, and Mr. Jensen’s executive employment agreements indicate they shall receive an amount equal to one times the sum of their base salary, plus one times their average short-term annual incentive compensation paid during the three years prior to termination; Ms. Mutch, Ms. Delahunt Hubbell,termination, as well as 12 months of continuing medical, dental, and Mr. Gaglia shall receive an amount equal to 1.5 times the sum of their base salary, plus their average annual incentive compensation paid during the three years prior tovision benefits after termination.
In the absence of an employment agreement, regardless of the manner in which a Named Executive Officer’s employment is terminated, he or she may receive amounts earned during his term of employment. Such amounts include:
salary;
grants and awards received under our equity plans, subject to the vesting and other terms applicable to such grants and awards;
amounts contributed and vested under our profit sharing plan and deferred compensation plan; and
unused paid time off.
In its discretion, the Board, or the Chief Executive Officer (except with regard to any payments made on his behalf) at their discretion, may authorize payment of additional separation amounts for the Named Executive Officers. The Board may also accelerateNEOs.
Additionally, the vesting of any unexercisable stock options or restricted stock awards outstanding at the time of termination. The amounts regarding applicable salaries, stock options, restricted stock awards, short-term incentives and deferred compensation for the most recent fiscal year ended December 31, 2018 are containedemployment agreements define payments in the various tables included above.event of an involuntary termination of employment without cause (as defined in each executive’s agreement) or voluntary termination by the executive for good reason (as defined in each executive’s agreement) within eighteen (18) months following the effective date of an acquisition that does not result in a change in control. The executive employment agreements provide that the executives shall receive an amount equal to two times their base salary (three times in the case of Mr. Riley) plus an amount equal to two times the average of the annual short-term incentive compensation paid to the executives (three times in the case of Mr. Riley) during each of the three years immediately prior to the year in which the Event of Termination occurs (with respect to each executive, the “Change in Control Payment”). The agreements further provide that the executives shall receive continued medical, dental, and vision benefits for 18 months (36 months in the case of Mr. Riley) after termination.
|
|
Payments Made uponPayments Made Upon Retirement |
Upon termination based on Retirement,retirement, a Named Executive OfficerNEO shall be entitled to all benefits under any retirement plan of the Company and other plans to which Named Executive OfficerNEO is a party.
|
|
Payments Made uponPayments Made Upon Death |
In the event of termination due to death, in addition to the benefits listed under the heading “Payments Made uponUpon Termination” above, the estates or other beneficiaries of the Named Executive OfficersNEOs are entitled to receive benefits under our group life insurance plan equal to the lesser of (i) 2.5two and a half times their respective base salary or (ii) $300,000. For all Named Executive Officers,NEOs, the applicable amount would be $300,000.
An additional $150,000 of survivor income benefit pursuant toIn addition, we have obtained life insurance policies coveringon selected officers of First Interstate Bank, is available towhich include a survivor benefit, as described above under the beneficiaries of Mr. Riley should death occur while he is employed by the Company.heading "Survivor Income Benefits."
|
|
Payments Made uponPayments Made Upon Disability |
In the event of termination due to disability, in addition to the benefits listed under the heading “Payments Made uponUpon Termination” above, the Named Executive OfficersNEOs are entitled to receive benefits under our group disability plan which generally provides for 60% of pre-disability earnings up to a maximum of $13,000 per month. For each of the Named Executive OfficersNEOs the applicable amount would be $13,000 per month.
|
|
Other Change in Control and Employment Termination |
The individual equity award agreements governing outstanding unvested restricted stockequity awards provides for accelerated vesting upon the recipient’s death or disability, as defined under the employment agreements.
PerPursuant to Section 409A of the Internal Revenue Code, certain payments to the Named Executive OfficersNEOs would not commence for six months following a termination of employment. If required by Code Section 409A, such payment or a portion of such payment (to the minimum extent possible) shall be delayed and shall be paid on the first day of the seventh month following Named Executive Officer’sNEO’s separation from service.
The following tables show estimated payments that our Named Executive OfficersNEOs may have receivedreceive assuming various employment termination and change-in-control scenarios occurringas if they occurred on December 31, 2018. The amounts shown in the tables reflect estimated amounts.2021. The actual amounts for those NEOs would need to be calculated uponbased on facts as of the actual termination of employment.
Post-Employment Payments
Potential Payments Upon Termination or Change-in-Control Payments
as of 12/31/2021 - Mr. Kevin P. Riley | | | | | | | | | | | | | | | | | | | | | | | | | | | | | |
| | | | Involuntary | Change in Control | | |
| Executive Payments and | | | Involuntary | Termination Without | With Termination | | |
| Benefits upon Termination | | Voluntary | Termination | Cause / Termination | for Good Reason | | |
| or Change in Control | | Termination | for Cause | for Good Reason | or Without Cause | Death | Disability |
| Compensation: | | | | | | | | | |
| Severance | | $ | — | | $ | — | | $ | 2,768,951 | | (a) | $ | 4,703,265 | | (b) | $ | — | | $ | — | |
| Pro-rata Bonus | | — | | — | | — | | | 696,780 | | (c) | — | | — | |
| Long-term Incentives | | | | | | | | | |
- Time-Restricted Awards (d) | | — | | — | | — | | | 932,116 | | | 932,116 | | 932,116 | |
- Performance Awards (e) | | — | | — | | — | | | 2,124,789 | | | 2,124,789 | | 2,124,789 | |
Supplemental Retirement (f) | | — | | — | | — | | | 562,767 | | | 562,767 | | 562,767 | |
| Benefits & Perquisites: | | | | | | | | | |
Survivor Income Benefits (g) | | — | | — | | — | | | — | | | 150,000 | | — | |
Health Benefits (h) | | — | | — | | 35,215 | | | 35,215 | | | — | | — | |
| Total | | $ | — | | $ | — | | $ | 2,804,166 | | | $ | 9,054,932 | | | $ | 3,769,672 | | $ | 3,619,672 | |
|
|
Potential Payments Upon Termination or Change-In-Control Payments as of 12/31/2018 - Mr. Kevin Riley |
|
| | | | | | | | | | | | | | | | | | | | | |
| | | | | Involuntary | Change in Control | | |
| Executive Payments and | | | Involuntary | Termination Without | With Termination | | |
| Benefits upon Termination | | Voluntary | Termination | Cause / Termination | for Good Reason | | |
| or Change in Control | | Termination | for Cause | for Good Reason | or Without Cause | Death | Disability |
| | | | | | | | | | |
| Compensation: | | | | | | | | | |
| Severance | | $ | — |
| $ | — |
| $ | 1,914,042 |
| (a) | $ | 2,709,288 |
| (b) | $ | — |
| $ | — |
|
| Pro-rata Bonus | | — |
| — |
| — |
| | 602,064 |
| (c) | — |
| — |
|
| Long-term Incentives | | | | | | | | | |
- Time Vesting Restricted Stock (d) | | — |
| — |
| — |
| | 563,901 |
| | 563,901 |
| 563,901 |
|
- Performance Awards (e) | | — |
| — |
| — |
| | 807,171 |
| | 807,171 |
| 807,171 |
|
Supplemental Retirement (f) | | — |
| — |
| — |
| | 703,929 |
| | 703,929 |
| 703,929 |
|
| Benefits & Perquisites: | | | | | | | | | |
Survivor Income Benefits (g) | | — |
| — |
| — |
| | — |
| | 150,000 |
| — |
|
Health Benefits (h) | | — |
| — |
| 25,383 |
| | 25,383 |
| | — |
| — |
|
| Total | | $ | — |
| $ | — |
| $ | 1,939,425 |
| | $ | 5,411,736 |
| | $ | 2,225,001 |
| $ | 2,075,001 |
|
|
| |
| (a) | Severance amount is equal to two times the sum of:of Mr. Riley’sRiley's current base salary, plus his average annual incentive compensation paid during the three years prior to termination (2015, 2016, 2017)(2018, 2019, and 2020), when the termination event is not in connection with a change-in-control or following an acquisition of an entity. Severance would increase to $4,153,427 (three times the compensation described herein) if the termination event followed an acquisition of an entity not constituting a change-in-control. Benefits are payable over 18 months. |
| (b) | Severance amount is equal to twothree times the sum of:of Mr. Riley’sRiley's current base salary plus his 20182021 target annual cash incentive, payable over 18 months. |
| (c) | Reflects Mr. Riley’sRiley's target annual cash incentive award pro-rated for the portion of the year prior to termination. Because termination is assumed to occur on December 31, 2018,2021, the amount reflects the full target cash award that would be payable in lieu of his 20182020 annual incentive award. |
| (d) | Reflects full vesting of time-based restricted stock awards upon a qualifying termination during the 24 month period following a change-in-control, and in the event of death, or disability. Awards are valued using the December 31, 20182021, closing price of $36.56.$40.67. |
| (e) | Reflects vesting of performance-based restricted stock awards (including dividends accrued through December 31, 2018)2021) upon a qualifying termination during the 24 month24-month period following a change-in-control, and in the event of death or disability, payable at target levels. Awards are valued using the December 31, 20182021 closing price of $36.56.$40.67. |
| (f) | Reflects full vesting of Mr. Riley’sRiley's unvested nonqualified defined contribution supplemental executive retirement plan balance upon a qualifying termination in connection with a change-in-control, and in the event of death, or disability. Amounts include annual and performance contingent contributions earned for service Mr. Riley has provided through December 31, 2018.2021. |
| (g) | Reflects $150,000 of survivor income benefits payable to Mr. Riley’sRiley's beneficiaries through a company owned life insurance policy covering the life of Mr. Riley. Mr. Riley’sRiley's beneficiaries would also be entitled to receive $300,000 of life insurance benefits under our group life insurance plan. |
| (h) | Estimates the cost of continuing medical, dental, and vision benefits for 1824 months for a qualifying termination using 20182021 COBRA rates. If the termination event followed an acquisition of an entity not constituting a change-in-control, costs are estimated as $52,823 as benefits would continue for 36 months. |
Potential Payments Upon Termination or Change-in-Control Payments
as of 12/31/2021 - Ms. Marcy D. Mutch | | | | | | | | | | | | | | | | | | | | | | | | | | | | | |
| | | | Involuntary | Change in Control | | |
| Executive Payments and | | | Involuntary | Termination Without | With Termination | | |
| Benefits upon Termination | | Voluntary | Termination | Cause / Termination | for Good Reason | | |
| or Change in Control | | Termination | for Cause | for Good Reason | or Without Cause | Death | Disability |
| Compensation: | | | | | | | | | |
| Severance | | $ | — | | $ | — | | $ | 662,833 | | (a) | $ | 1,495,200 | | (b) | $ | — | | $ | — | |
| Pro-rata Bonus | | — | | — | | — | | | 280,350 | | (c) | — | | — | |
| Long-term Incentives | | | | | | | | | |
- Time-Restricted Awards (d) | | — | | — | | — | | | 298,965 | | | 298,965 | | 298,965 | |
- Performance Awards (e) | | — | | — | | — | | | 727,455 | | | 727,455 | | 727,455 | |
| Benefits & Perquisites: | | | | | | | | | |
Survivor Income Benefits (f) | | | | — | | | — | | | 150,000 | | — | |
Health Benefits (g) | | — | | — | | 17,747 | | | 35,495 | | | — | | — | |
| Total | | $ | — | | $ | — | | $ | 680,580 | | | $ | 2,837,465 | | | $ | 1,176,420 | | $ | 1,026,420 | |
|
|
Potential Payments Upon Termination or Change-In-Control Payments as of 12/31/2018 - Ms. Marcy Mutch |
|
| | | | | | | | | | | | | | | | | | | | | |
| | | | | Involuntary | Change in Control | | |
| Executive Payments and | | | Involuntary | Termination Without | With Termination | | |
| Benefits upon Termination | | Voluntary | Termination | Cause / Termination | for Good Reason | | |
| or Change in Control | | Termination | for Cause | for Good Reason | or Without Cause | Death | Disability |
| | | | | | | | | | |
| Compensation: | | | | | | | | | |
| Severance | | $ | — |
| $ | — |
| $ | 453,333 |
| (a) | $ | 866,250 |
| (b) | $ | — |
| $ | — |
|
| Pro-rata Bonus | | — |
| — |
| — |
| | 192,500 |
| (c) | — |
| — |
|
| Long-term Incentives | | | | | | | | | |
- Time Vesting Restricted Stock (d) | | — |
| — |
| — |
| | 167,737 |
| | 167,737 |
| 167,737 |
|
- Performance Awards (e) | | — |
| — |
| — |
| | 262,505 |
| | 262,505 |
| 262,505 |
|
| Benefits & Perquisites: | | | | | | | | | |
Health Benefits (f) | | — |
| — |
| 15,985 |
| | 23,978 |
| | — |
| — |
|
| Total | | $ | — |
| $ | — |
| $ | 469,318 |
| | $ | 1,512,970 |
| | $ | 430,242 |
| $ | 430,242 |
|
|
| | |
| (a) | Severance amount is equal to one times the sum of:of Ms. Mutch’sMutch's current base salary, plus her average annual incentive compensation paid during the three years prior to termination (2015, 2016, 2017)(2018, 2019, and 2020), when the termination event is not in connection with a change-in-control or following an acquisition of an entity. Severance would increase to $1,325,667 (two times the compensation described herein) if the termination event followed an acquisition of an entity not constituting a change-in-control. Benefits are payable over 18 months. |
| (b) | Severance amount is equal to onetwo times the sum of: Ms. Mutch’sMutch's current base salary plus her 20182021 target annual cash incentive, payable over 18 months. |
| (c) | Reflects Ms. Mutch’sMutch's target annual cash incentive award pro-rated for the portion of the year prior to termination. Because termination is assumed to occur on December 31, 2018,2021, the amount reflects the full target cash award that would be payable in lieu of her 20182021 annual incentive award. |
| (d) | Reflects full vesting of time-based restricted stock awards upon a qualifying termination during the 24 month period following a change-in-control, and in the event of death or disability. Awards are valued using the December 31, 20182021 closing price of $36.56.$40.67. |
| (e) | Reflects vesting of performance-based restricted stock awards (including dividends accrued through December 31, 2018)2021) upon a qualifying termination during the 24 month period following a change-in-control, and in the event of death or disability, payable at target levels. Awards are valued using the December 31, 20182021 closing price of $36.56.$40.67. |
| (f) | Reflects $150,000 of survivor income benefits payable to Ms. Mutch's beneficiaries through a company owned life insurance policy covering the life of Ms. Mutch. Ms. Mutch's beneficiaries would also be entitled to receive $300,000 of life insurance benefits under our group life insurance plan. |
| (g) | Estimates the cost of continuing medical, dental, and vision benefits, using 20182021 COBRA rates. Assumes 12 months of continued coverage for a qualifying termination not in connection with a change-in-control and 1824 months of continued coverage for a termination in connection with a change-in-control. If the termination event followed an acquisition of an entity not constituting a change-in-control, costs are estimated to be $26,621, as benefits would continue for 18 months. |
Potential Payments Upon Termination or Change-in-Control Payments
as of 12/31/2021 - Ms. Jodi Delahunt Hubbell | | | | | | | | | | | | | | | | | | | | | | | | | | | | | |
| | | | Involuntary | Change in Control | | |
| Executive Payments and | | | Involuntary | Termination Without | With Termination | | |
| Benefits upon Termination | | Voluntary | Termination | Cause / Termination | for Good Reason | | |
| or Change in Control | | Termination | for Cause | for Good Reason | or Without Cause | Death | Disability |
| Compensation: | | | | | | | | | |
| Severance | | $ | — | | $ | — | | $ | 633,026 | | (a) | $ | 1,427,581 | | (b) | $ | — | | $ | — | |
| Pro-rata Bonus | | — | | — | | — | | | 267,671 | | (c) | — | | — | |
| Long-term Incentives | | | | | | | | | |
- Time-Restricted Awards (d) | | — | | — | | — | | | 271,960 | | | 271,960 | | 271,960 | |
- Performance Awards (e) | | — | | — | | — | | | 627,104 | | | 627,104 | | 627,104 | |
| Benefits & Perquisites: | | | | | | | | | |
Survivor Income Benefits (f) | | — | | — | | — | | | — | | | 150,000 | | — | |
Health Benefits (g) | | — | | — | | 16,610 | | | 33,221 | | | — | | — | |
| Total | | $ | — | | $ | — | | $ | 649,636 | | | $ | 2,627,537 | | | $ | 1,049,064 | | $ | 899,064 | |
|
|
Potential Payments Upon Termination or Change-In-Control Payments as of 12/31/2018 - Ms. Jodi Delahunt Hubbell |
|
| | | | | | | | | | | | | | | | | | | | | |
| | | | | Involuntary | Change in Control | | |
| Executive Payments and | | | Involuntary | Termination Without | With Termination | | |
| Benefits upon Termination | | Voluntary | Termination | Cause / Termination | for Good Reason | | |
| or Change in Control | | Termination | for Cause | for Good Reason | or Without Cause | Death | Disability |
| | | | | | | | | | |
| Compensation: | | | | | | | | | |
| Severance | | $ | — |
| $ | — |
| $ | 375,000 |
| (a) | $ | 843,750 |
| (b) | $ | — |
| $ | — |
|
| Pro-rata Bonus | | — |
| — |
| — |
| | 187,500 |
| (c) | — |
| — |
|
| Long-term Incentives | | | | | | | | | |
- Time Vesting Restricted Stock (d) | | — |
| — |
| — |
| | 211,280 |
| | 211,280 |
| 211,280 |
|
- Performance Awards (e) | | — |
| — |
| — |
| | 86,132 |
| | 86,132 |
| 86,132 |
|
| Benefits & Perquisites: | | | | | | | | | |
Health Benefits (f) | | — |
| — |
| 15,985 |
| | 23,978 |
| | — |
| — |
|
| Total | | $ | — |
| $ | — |
| $ | 390,985 |
| | $ | 1,352,640 |
| | $ | 297,412 |
| $ | 297,412 |
|
|
| | |
| (a) | Severance amount is equal to one times the sum of:of Ms. Delahunt Hubbell’sDelahunt-Hubbell's current base salary, plus her average annual incentive compensation paid during the three years prior to termination (2015, 2016, 2017)(2018, 2019, and 2020), payable over 18 months.when the termination event is not in connection with a change-in-control or following an acquisition of an entity. Severance would increase to $1,266,051 (two times the compensation described herein) if the termination event followed an acquisition of an entity not constituting a change-in-control. Since Ms. Delahunt HubbellDelahunt-Hubbell (who joined the Company in 2017) did not receive an annual bonus in 2018, only the bonuses paid in 2015, 2016,2019 and 2017, no bonus component has been used to compute her severance.2020 were averaged. Benefits are payable over 18 months. |
| (b) | Severance amount is equal to onetwo times the sum of:of Ms. Delahunt Hubbell’sDelahunt-Hubbell's current base salary plus her 20182021 target annual cash incentive, payable over 18 months. |
| (c) | Reflects Ms. Delahunt Hubbell’sDelahunt-Hubbell's target annual cash incentive award pro-rated for the portion of the year prior to termination. Because termination is assumed to occur on December 31, 2018,2021, the amount reflects the full target cash award that would be payable in lieu of her 20182021 annual incentive award. |
| (d) | Reflects full vesting of time-based restricted stock awards upon a qualifying termination during the 24 month period following a change-in-control, and in the event of death or disability. Awards are valued using the December 31, 20182021 closing price of $36.56.$40.67. |
| (e) | Reflects vesting of performance-based restricted stock awards (including dividends accrued through December 31,2018)31, 2021) upon a qualifying termination during the 24 month period following a change-in-control, and in the event of death or disability, payable at target levels. Awards are valued using the December 31, 20182021 closing price of $36.56.$40.67. |
| (f) | Reflects $150,000 of survivor income benefits payable to Ms. Delahunt-Hubbell's beneficiaries through a company owned life insurance policy covering the life of Ms. Delahunt-Hubbell. Ms. Delahunt-Hubbell's beneficiaries would also be entitled to receive $300,000 of life insurance benefits under our group life insurance plan. |
| (g) | Estimates the cost of continuing medical, dental, and vision benefits, using 20182021 COBRA rates. Assumes 12 months of continued coverage for a qualifying termination not in connection with a change-in-control and 1824 months of continued coverage for a termination in connection with a change-in-control. If the termination event followed an acquisition of an entity not constituting a change-in-control, costs are estimated to be $24,916, as benefits would continue for 18 months. |
Potential Payments Upon Termination or Change-in-Control Payments
as of 12/31/2021 - Mr. Russell A. Lee
| | | | | | | | | | | | | | | | | | | | | | | | | | | | | |
| | | | Involuntary | Change in Control | | |
| Executive Payments and | | | Involuntary | Termination Without | With Termination | | |
| Benefits upon Termination | | Voluntary | Termination | Cause / Termination | for Good Reason | | |
| or Change in Control | | Termination | for Cause | for Good Reason | or Without Cause | Death | Disability |
| Compensation: | | | | | | | | | |
| Severance | | $ | — | | $ | — | | $ | 555,200 | | (a) | $ | 1,175,040 | | (b) | $ | — | | $ | — | |
| Pro-rata Bonus | | — | | — | | — | | | 220,320 | | (c) | — | | — | |
| Long-term Incentives | | | | | | | | | |
- Time-Restricted Awards (d) | | 125,589 | | 125,589 | | 125,589 | | | 125,589 | | | 125,589 | | 125,589 | |
- Performance Awards (e) | | 241,087 | | 241,087 | | 241,087 | | | 241,087 | | | 241,087 | | 241,087 | |
| Benefits & Perquisites: | | | | | | | | | |
Survivor Income Benefits (f) | | — | | — | | — | | | — | | | — | | — | |
Health Benefits (g) | | — | | — | | 17,747 | | | 35,495 | | | — | | — | |
| Total | | $ | 366,676 | | $ | 366,676 | | $ | 939,623 | | | $ | 1,797,531 | | | $ | 366,676 | | $ | 366,676 | |
|
|
Potential Payments Upon Termination or Change-In-Control Payments as of 12/31/2018 - Mr. Kirk D. Jensen |
|
| | | | | | | | | | | | | | | | | | | | | |
| | | | | Involuntary | Change in Control | | |
| Executive Payments and | | | Involuntary | Termination Without | With Termination | | |
| Benefits upon Termination | | Voluntary | Termination | Cause / Termination | for Good Reason | | |
| or Change in Control | | Termination | for Cause | for Good Reason | or Without Cause | Death | Disability |
| | | | | | | | | | |
| Compensation: | | | | | | | | | |
| Severance | | $ | — |
| $ | — |
| $ | — |
| (a) | $ | — |
| (b) | $ | — |
| $ | — |
|
| Pro-rata Bonus | | — |
| — |
| — |
| | — |
| (c) | — |
| — |
|
| Long-term Incentives | | | | | | | | | |
- Time Vesting Restricted Stock (d) | | — |
| — |
| — |
| | 138,782 |
| | 138,782 |
| 138,782 |
|
- Performance Awards (e) | | — |
| — |
| — |
| | 217,408 |
| | 217,408 |
| 217,408 |
|
| Benefits & Perquisites: | | | | | | | | | |
Health Benefits (f) | | — |
| — |
| — |
| | — |
| | — |
| — |
|
| Total | | $ | — |
| $ | — |
| $ | — |
| | $ | 356,190 |
| | $ | 356,190 |
| $ | 356,190 |
|
|
| |
(a) | Reflects full vesting of time-based restricted stock awards upon a qualifying termination during the 24 month period following a change-in-control, and in the event of death, or disability. Awards are valued using the December 31, 2018 closing price of $36.56. |
(b) | Reflects vesting of performance-based restricted stock awards (including dividends accrued through December 31, 2018) upon a qualifying termination during the 24 month period following a change-in-control, and in the event of death or disability, payable at target levels. Awards are valued using the December 31, 2018 closing price of $36.56. |
|
|
Potential Payments Upon Termination or Change-In-Control Payments as of 12/31/2018 - Mr. Philip Gaglia |
|
| | | | | | | | | | | | | | | | | | | | | |
| | | | | Involuntary | Change in Control | | |
| Executive Payments and | | | Involuntary | Termination Without | With Termination | | |
| Benefits upon Termination | | Voluntary | Termination | Cause / Termination | for Good Reason | | |
| or Change in Control | | Termination | for Cause | for Good Reason | or Without Cause | Death | Disability |
| | | | | | | | | | |
| Compensation: | | | | | | | | | |
| Severance | | $ | — |
| $ | — |
| $ | 319,594 |
| (a) | $ | 584,100 |
| (b) | $ | — |
| $ | — |
|
| Pro-rata Bonus | | — |
| — |
| — |
| | 129,800 |
| (c) | — |
| — |
|
| Long-term Incentives | | | | | | | | | |
- Time Vesting Restricted Stock (d) | | — |
| — |
| — |
| | 111,508 |
| | 111,508 |
| 111,508 |
|
- Performance Awards (e) | | — |
| — |
| — |
| | 172,265 |
| | 172,265 |
| 172,265 |
|
| Benefits & Perquisites: | | | | | | | | | |
Health Benefits (f) | | — |
| — |
| 23,132 |
| | 34,697 |
| | — |
| — |
|
| Total | | $ | — |
| $ | — |
| $ | 342,726 |
| | $ | 1,032,370 |
| | $ | 283,773 |
| $ | 283,773 |
|
|
| |
| (a) | Severance amount is equal to one times the sum of:of Mr. Gaglia’sLee's current base salary, plus his average annual incentive compensation paid during the three years prior to termination (2015, 2016, 2017)(2018, 2019, and 2020), when the termination event is not in connection with a change-in-control or following an acquisition of an entity. Severance would increase to $1,110,400 (two times the compensation described herein) if the termination event followed an acquisition of an entity not constituting a change-in-control. Since Mr. Lee (who joined the Company in 2018) did not receive an annual bonus from the Company in 2018, only the bonuses paid in 2019 and 2020 were averaged. Benefits are payable over 18 months. |
| (b) | Severance amount is equal to one and a halftwo times the sum of:of Mr. Gaglia’sLee's current base salary plus his 20182021 target annual cash incentive, payable over 18 months. |
| (c) | Reflects Mr. Gaglia’sLee’s target annual cash incentive award pro-rated for the portion of the year prior to termination. Because termination is assumed to occur on December 31, 2018,2021, the amount reflects the full target cash award that would be payable in lieu of his 20182021 annual incentive award. |
| (d) | Reflects full vesting of time-based restricted stock awards. Assumes Mr. Lee's termination for any reason would constitute a qualifying Retirement under the terms of the equity awards, which would result in full vesting. Awards are valued using the December 31, 2021 closing price of $40.67. |
| (e) | Reflects full vesting of performance-based restricted stock awards. Assumes Mr. Lee's termination for any reason would constitute a qualifying Retirement under the terms of the equity awards, which would result in full vesting. Awards are valued using the December 31, 2021 closing price of $40.67. |
| (f) | Estimates the cost of continuing medical, dental, and vision benefits, using 2021 COBRA rates. Assumes 12 months of continued coverage for a qualifying termination not in connection with a change-in-control and 24 months of continued coverage for a termination in connection with a change-in-control. If the termination event followed an acquisition of an entity not constituting a change-in-control, costs are estimated to be $26,621, as benefits would continue for 18 months. |
Potential Payments Upon Termination or Change-in-Control Payments
as of 12/31/2021 - Mr. Kirk D. Jensen
| | | | | | | | | | | | | | | | | | | | | | | | | | | | | |
| | | | Involuntary | Change in Control | | |
| Executive Payments and | | | Involuntary | Termination Without | With Termination | | |
| Benefits upon Termination | | Voluntary | Termination | Cause / Termination | for Good Reason | | |
| or Change in Control | | Termination | for Cause | for Good Reason | or Without Cause | Death | Disability |
| Compensation: | | | | | | | | | |
| Severance | | $ | — | | $ | — | | $ | 494,759 | | (a) | $ | 1,041,420 | | (b) | $ | — | | $ | — | |
| Pro-rata Bonus | | — | | — | | — | | | 173,570 | | (c) | — | | — | |
| Long-term Incentives | | | | | | | | | |
- Time-Restricted Awards (d) | | — | | — | | — | | | 142,670 | | | 142,670 | | 142,670 | |
- Performance Awards (e) | | — | | — | | — | | | 352,423 | | | 352,423 | | 352,423 | |
| Benefits & Perquisites: | | | | | | | | | |
Survivor Income Benefits (f) | | — | | — | | — | | | — | | | 150,000 | | — | |
Health Benefits (g) | | — | | — | | 24,281 | | | 48,562 | | | — | | — | |
| Total | | $ | — | | $ | — | | $ | 519,040 | | | $ | 1,758,645 | | | $ | 645,093 | | $ | 495,093 | |
| | | | | |
| (a) | Severance is equal to one times the sum of Mr. Jensen's current base salary, plus his average annual incentive compensation paid during the three years prior to termination (2018, 2019, and 2020), when the termination event is not in connection with a change-in-control or following an acquisition of an entity. Severance would increase to $989,518 (two times the compensation described herein) if the termination event followed an acquisition of an entity not constituting a change-in-control. Benefits are payable over 18 months. |
| (b) | Severance is equal to two times the sum of Mr. Jensen's current base salary plus his 2021 target annual cash incentive, payable over 18 months. |
| (c) | Reflects Mr Jensen's target annual cash incentive award pro-rated for the portion of the year prior to termination. Because termination is assumed to occur on December 31, 2021, the amount reflects the full target cash award that would be payable in lieu of his 2021 annual incentive award. |
| (d) | Reflects full vesting of time-based restricted stock awards upon a qualifying termination during the 24 month period following a change-in-control, and in the event of death or disability. Awards are valued using the December 31, 20182021, closing price of $36.56.$40.67. |
| (e) | Reflects vesting of performance-based restricted stock awards (including dividends accrued through December 31, 2018)2021) upon a qualifying termination during the 24 month period following a change-in-control, and in the event of death or disability, payable at target levels. Awards are valued using the December 31, 20182021 closing price of $36.56.$40.67. |
| (f) | Reflects $150,000 of survivor income benefits payable to Mr. Jensen's beneficiaries through a company owned life insurance policy covering the life of Mr. Jensen. Mr. Jensen's beneficiaries would also be entitled to receive $300,000 of life insurance benefits under our group life insurance plan. |
| (g) | Estimates the cost of continuing medical, dental, and vision benefits, using 20182021 COBRA rates. Assumes 12 months of continued coverage for a qualifying termination not in connection with a change-in-control and 1824 months of continued coverage for a termination in connection with a change-in-control. |
|
|
Potential Payments Upon Termination or Change-In-Control Payments If the termination event followed an acquisition of an entity not constituting a change-in-control, costs are estimated to be $36,421, as of 12/31/2018 - Mr. William D. Gottwalsbenefits would continue for 18 months. |
|
| | | | | | | | | | | | | | | | | | | | | |
| | | | | Involuntary | Change in Control | | |
| Executive Payments and | | | Involuntary | Termination Without | With Termination | | |
| Benefits upon Termination | | Voluntary | Termination | Cause / Termination | for Good Reason | | |
| or Change in Control | | Termination | for Cause | for Good Reason | or Without Cause | Death | Disability |
| | | | | | | | | | |
| Compensation: | | | | | | | | | |
| Severance | | $ | — |
| $ | — |
| $ | — |
| (a) | $ | — |
| (b) | $ | — |
| $ | — |
|
| Pro-rata Bonus | | — |
| — |
| — |
| | — |
| (c) | — |
| — |
|
| Long-term Incentives | | | | | | | | | |
- Time Vesting Restricted Stock (d) | | — |
| — |
| — |
| | 140,719 |
| | 140,719 |
| 140,719 |
|
- Performance Awards (e) | | — |
| — |
| — |
| | 238,302 |
| | 238,302 |
| 238,302 |
|
| Benefits & Perquisites: | | | | | | | | | |
Health Benefits (f) | | — |
| — |
| — |
| | — |
| | — |
| — |
|
| Total | | $ | — |
| $ | — |
| $ | — |
| | $ | 379,021 |
| | $ | 379,021 |
| $ | 379,021 |
|
|
| |
(a) | Reflects full vesting of time-based restricted stock awards upon a qualifying termination during the 24 month period following a change-in-control, and in the event of death, or disability. Awards are valued using the December 31, 2018 closing price of $36.56. |
(b) | Reflects vesting of performance-based restricted stock awards (including dividends accrued through December 31, 2018) upon a qualifying termination during the 24 month period following a change-in-control, and in the event of death or disability, payable at target levels. Awards are valued using the December 31, 2018 closing price of $36.56. |
|
|
Potential Payments Upon Termination or Change-In-Control Payments as of 12/31/2018 - Mr. Stephen W. Yose |
|
| | | | | | | | | | | | | | | | | | | | | |
| | | | | Involuntary | Change in Control | | |
| Executive Payments and | | | Involuntary | Termination Without | With Termination | | |
| Benefits upon Termination | | Voluntary | Termination | Cause / Termination | for Good Reason | | |
| or Change in Control | | Termination | for Cause | for Good Reason | or Without Cause | Death | Disability |
| | | | | | | | | | |
| Compensation: | | | | | | | | | |
| Severance | | $ | — |
| $ | — |
| $ | — |
| (a) | $ | — |
| (b) | $ | — |
| $ | — |
|
| Pro-rata Bonus | | — |
| — |
| — |
| | — |
| (c) | — |
| — |
|
| Long-term Incentives | | | | | | | | | |
- Time Vesting Restricted Stock (d) | | — |
| — |
| — |
| | 192,781 |
| | 192,781 |
| 192,781 |
|
- Performance Awards (e) | | — |
| — |
| — |
| | 135,610 |
| | 135,610 |
| 135,610 |
|
| Benefits & Perquisites: | | | | | | | | | |
Health Benefits (f) | | — |
| — |
| — |
| | — |
| | — |
| — |
|
| Total | | $ | — |
| $ | — |
| $ | — |
| | $ | 328,391 |
| | $ | 328,391 |
| $ | 328,391 |
|
|
| |
(a) | Reflects full vesting of time-based restricted stock awards upon a qualifying termination during the 24 month period following a change-in-control, and in the event of death, or disability. Awards are valued using the December 31, 2018 closing price of $36.56. |
(b) | Reflects vesting of performance-based restricted stock awards (including dividends accrued through December 31, 2018) upon a qualifying termination during the 24 month period following a change-in-control, and in the event of death or disability, payable at target levels. Awards are valued using the December 31, 2018 closing price of $36.56. |
We use a combination of cash and stock-basedequity-based incentive compensation to attract and retain qualified candidates to serve on our Board. In setting director compensation, we consider the significant amount of time that directors expend in fulfilling their duties as well as the skill level required by us with respect to members of the Board.
During 2018,2021, each director, other than Kevin P. Riley and James R. Scott,David L. Jahnke, received an annual retainer valued at $50,000,$100,000, with at least $25,000$55,000 of that being paid in the form of equity and the remaining $25,000remainder paid in the form of cash or First Interstate Class A common stock at the Director’sdirector's election.
For his services as Chair of the Board, James R. ScottDavid L. Jahnke received an annual retainer of $229,998,$165,000. Mr. Jahnke received $85,000 of which $120,000 was paid to him in quarterly installments of $30,000, and $109,998 was issuedhis retainer in the form of company stock.stock and $80,000 in the form of cash. These retainers were in lieu of all director fees and other retainers described above. The retainer paid to James R. ScottDavid L. Jahnke recognizes his work in providing an interface between the Board and our management, oversight of strategic planning, leadership of the Board, deployment and the creation of shareholder value, executive succession planning, and community visibility.
Committee members and committee chairs and our lead independent directorchairpersons received additional compensation as follows: | | | Committee | Chair Retainer | | Member Retainer | Committee | Chair Retainer | Member Retainer |
| Audit | $12,500 | | $10,000 | Audit | $12,500 | $10,000 |
| Compensation | 11,250 | | 7,500 | |
| Compensation and Human Capital | | Compensation and Human Capital | 11,250 | 7,500 |
| Executive | — | | 5,000 | Executive | — | 5,000 |
| Governance | 10,000 | | 5,000 | |
| Governance and Nominating | | Governance and Nominating | 10,000 | 7,500 |
| Risk | 11,250 | | 7,500 | Risk | 11,250 | 7,500 |
| Technology | 10,000 | | 5,000 | Technology | 10,000 | 5,000 |
| Lead Independent Director | — | | 2,500 | |
| Bank: Market Strategy | — | | 3,750 | |
| Bank: Facilities | — | | 3,750 | |
Directors are reimbursed for ordinary expenses incurred in connection with attending Boardboard and committee meetings. Under our deferred compensation plan, directors may elect to defer any cash portion of director’s fees until an elective distribution date or the director’s retirement, disability, or death.
|
| |
| Director Compensation Table |
|
| | | | | |
| Name | Fees Earned | Stock | Options | All Other | |
| or Paid in Cash | Awards | Awards | Compensation | Total |
| ($) | ($)(1) | ($) | ($)(2) | ($) |
| | | | | | |
| James R. Scott | $120,000 | $109,998 | $— | $— | $229,998 |
Kevin P. Riley(3) | — | — | — | — | — |
| Steven J. Corning | 48,438 | 24,968 | 49,154 | — | 122,560 |
| Dana L. Crandall | 30,625 | 49,979 | — | — | 80,604 |
| William B. Ebzery | 35,000 | 24,968 | 96,635 | — | 156,603 |
| Charles E. Hart, M.D. | 51,875 | 24,968 | 83,170 | — | 160,013 |
| John Heyneman | 28,125 | 24,968 | — | — | 53,093 |
| David L. Jahnke | 58,750 | 24,968 | — | — | 83,718 |
Dennis L. Johnson (4) | 44,687 | 24,968 | — | 34,461 | 104,116 |
| Ross E. Leckie | 55,312 | 24,968 | 26,226 | — | 106,506 |
| Patricia L. Moss | 45,312 | 24,968 | — | — | 70,280 |
James R. Scott Jr.(2) | 18,125 | 49,979 | — | 156,139 | 224,243 |
Jonathan R. Scott (2) | 25,625 | 37,495 | 403,857 | 139,784 | 606,761 |
Randall I. Scott(5) | 10,875 | — | — | — | 10,875 |
| Teresa A. Taylor | 55,625 | 24,968 | — | — | 80,593 |
Theodore H. Williams(6) | 3,750 | — | — | — | 3,750 |
| Peter I. Wold | 42,812 | 24,968 | — | — | 68,080 |
| | | | | | | | | | | | | | |
| Name | Fees Earned or Paid In Cash | Stock Awards (1) | Options Awards | Total |
| David L. Jahnke | $ | 78,750 | | $ | 85,000 | | $ | — | | $ | 163,750 | |
Kevin P. Riley (2) | $ | — | | $ | — | | $ | — | | $ | — | |
| Stephen B. Bowman | $ | 35,000 | | $ | 93,715 | | $ | — | | $ | 128,715 | |
| Alice S. Cho | $ | 66,250 | | $ | 55,000 | | $ | — | | $ | 121,250 | |
| Dana L. Crandall | $ | 43,625 | | $ | 55,000 | | $ | — | | $ | 98,625 | |
| John M. Heyneman, Jr. | $ | 66,250 | | $ | 55,000 | | $ | — | | $ | 121,250 | |
| Dennis L. Johnson | $ | 77,500 | | $ | 55,000 | | $ | — | | $ | 132,500 | |
| Ross E. Leckie | $ | 45,000 | | $ | 100,000 | | $ | — | | $ | 145,000 | |
| Patricia L. Moss | $ | 75,000 | | $ | 55,000 | | $ | — | | $ | 130,000 | |
| Joyce Phillips | $ | 60,000 | | $ | 66,219 | | | $ | 126,219 | |
| James R. Scott | $ | 14,375 | | $ | 100,000 | | $ | — | | $ | 114,375 | |
| James R. Scott Jr. | $ | 14,375 | | $ | 100,000 | | $ | — | | $ | 114,375 | |
| Jonathan R. Scott | $ | 34,375 | | $ | 77,500 | | $ | — | | $ | 111,875 | |
(1)The amounts reflect the aggregate grant date fair value computed in accordance with FASB ASC Topic 718. Because of the limited number of equity awards granted to non-employee directors, the number of outstanding equity awards held by the directors on December 31, 2021 was not materially different from the amounts reflected in the relevant footnotes to the Beneficial Ownership Table included herein under the heading “Security Ownership of Certain Beneficial Owners and Management.”
(2)Mr. Riley received no compensation for serving as a director, but he was compensated in his capacity as President and Chief Executive Officer and his compensation is included herein in the “Summary Compensation Table.”
| |
(1)
| The amounts reflect the aggregate grant date fair value computed in accordance with FASB ASC Topic 718. Because of the limited number of stock awards granted to non-employee directors, the number of outstanding stock awards held by the directors at December 31, 2018 was not materially different from the amounts reflected in the relevant footnotes to the Beneficial Ownership Table included herein under the heading “Security Ownership of Certain Beneficial Owners and Management.” |
| |
(2)
| The amounts in All Other Compensation includes compensation as an employee of the Company. |
| |
(3)
| Mr. Riley received no compensation for serving as a director, but he was compensated in his capacity as President and Chief Executive Officer and his compensation is included herein in the “Summary Compensation Table.” |
| |
(4)
| Mr. Johnson received a one-time payment of $32,461 in 2018, which is reflected under All Other Compensation, for the payout of his deferred Restricted Stock Units which were issued under the Cascade BancorpDirector Equity & Incentive Plan as a director of Cascade Bancorp. |
| |
(5)
| Due to term limits that require certain Scott family members to have at least a one-year break in service after serving two consecutive three-year terms, Randall I. Scott’s most recent term ended in May of 2018. |
| |
(6)
| Mr. Williams announced his resignation as a director effective March 22, 2018. |
|
|
Director Stock Ownership Guidelines |
Under our stockequity ownership guidelines, each director is expectedencouraged to acquire and maintain ownership of our common stock equal in value to threefive times his or her annual cash and stock retainer. StockEquity holdings are measured at the end of each year using the year’syear average closing Class A common stock price. Under the policy, a director who is not in compliance with minimum ownership requirements must receive his or her annual retainer entirely in share of Class A common stock. Each director is expected to meettarget meeting the ownership guidelines within five years from the date he or she became a director. AllAt the end of 2021, all directors were in compliance with the exception of one recently elected director have metguidelines, including the recommended levels of stock ownership.grace periods, set forth in the policy.
Certain Relationships and Related Party Transactions |
|
CERTAIN RELATIONSHIPS AND RELATED TRANSACTIONS |
|
|
|
| Related Person Transaction Policy |
Our Board has adopted a related person transaction policywritten Related Person Transaction Policy that is applicable to our executive officers, directors, and certain entities and individuals related to such persons. TheWith the exception of certain transactions reviewed by the Chief Risk Officer and deemed to be preapproved, the policy, as amended, and as applied prior to the close of the Great Western transaction, generally provides that we will not enter into any transactions with related parties unless such transaction(s) are (1) reviewed by the subcommittee of independent directors of our Governance &and Nominating Committee after disclosure of the relevant facts and circumstances, including any benefits to the Company and the terms of any comparable products or services provided by unrelated third parties,parties; and (2) determined by the subcommittee of independent directors of our Governance &and Nominating Committee to be in the best interests of the Company and our shareholders,shareholders. The policy also provides that the chairmanchair of such committee,subcommittee, who is an independent director, has delegated authority to approve such transaction(s) in certain circumstances, subject to ratification by the subcommittee of independent directors of the Governance &and Nominating Committee. The policy does not apply to loan and credit transactions to directors and executive officers that are covered by Regulation O adopted by the Federal Reserve.
All of the ongoing related party transactions described belowrequiring approval were reviewed and approved by the subcommittee of independent directors of the Governance &and Nominating Committee in accordance with the policy. In addition, all pre-approved related party transactions were provided to the Independent Committee for review as required by policy. There were no related party transactions identified which were not subject to the policies and approvals above.
|
|
| Related Party Transactions |
We conduct banking transactions in the ordinary course of business with related parties, including directors, executive officers, shareholders, and their associates on the same terms as those prevailing at the same time for comparable transactions with unrelated persons and that do not involve more than a normal risk of collectability or present other unfavorable features.
Certain executive officers, directors, and greater than 5% shareholders of the Company and certain entities and individuals related to such persons havehad transactions with the Company in the ordinary course of business. These parties were deposit clients of the Bank and incurred indebtedness in the form of loans, as customers, in an amount equal to $43.2clients, of $19.5 million as of December 31, 2018.2021. During 2018,2021, new loans and advances on existing loans of $7.6$10.4 million were funded and loan repayments totaled $17.4$13.2 million. TheseNo loans were removed due to changes in related parties during the year. All deposit and loan transactions were made on substantially the same terms, including interest rates and collateral, as those prevailing at the time for comparable loanstransactions with persons not related to us.us and do not involve more than a normal risk of collectability or present other unfavorable features.
We lease an aircraft from an entity in which James R. Scott, current Chair of our Board, has a one-third ownership interest. UnderPursuant to the terms of the lease, we pay a fee for each flight hour. During 2018, we paid total fees and operating expenses of $53 thousand for our usestockholders’ agreement (the “stockholders’ agreement”), which became effective as of the aircraft. In addition, we leaseclosing of the Company’s merger with Great Western, among the Company and the members of the “Scott Family FIBK Shareholder Group” identified in the beneficial ownership table included elsewhere in this proxy statement, the Company agreed to pay all reasonable and documented out-of-pocket expenses incurred by the Scott Family FIBK Shareholder Group in connection with the Company’s merger with Great Western, up to a portionmaximum of our hanger and provide pilot services$8.5 million. Among the members of the Scott Family FIBK Shareholder Group who are a party to the related entity. During 2018, we received payments from the related entity for Mr. Scott’s personal use of the aircraft. These payments included $7 thousand for a lease to use the Company’s hanger and $25 thousand for reimbursement of pilot fees.
James R. Scott, Thomas W. Scott,stockholders’ agreement are three of our current directors, Messrs. James R. Scott, John M. Heyneman, Jr., and Jonathan R. Scott; the Scott and James R. Scott, Jr., and twoFamily FIBK Shareholder Group members of our control group, Homer A. Scott, Jr., who is also acollectively beneficially own greater than 5% shareholder individually, and Randall I. Scott, who is also a greater than 5% shareholder individually, each has a 1.85% interestof the outstanding shares of the Company’s Class A common stock. In connection with the completion of the merger in February 2022, the Company paid an aggregate of $8.2 million in expense reimbursement under the stockholders’ agreement to the members of the Scott Family Services, Inc. (“SFS”FIBK Shareholder Group.
In addition, pursuant to the stockholders’ agreement, the Company agreed to make a charitable contribution of $21.5 million to the First Interstate BancSystem Foundation (the “Foundation”), which provides professional services that benefit us and the Scott family. In addition, Randall I. Scott isCompany made in March 2022 following the chairman
closing of the Company’s merger with Great Western in accordance with the stockholders’ agreement. The directors on the board of directors of SFS. Services provided for our benefitthe Foundation include assistance with SEC compliance actions including the trackingfollowing Company directors, executive officers, or greater than 5% shareholders of the Company: Kevin P. Riley, Thomas E. Henning, Kirk D. Jensen, Russell A. Lee, Marcy D. Mutch, Joyce A. Phillips, James R. Scott, and administrationJulie Scott Rose (a deemed 5% shareholder as a member of the Scott Family FIBK stock ownership, administrationShareholder Group), each of whom may be deemed to have a material interest in the charitable contribution by virtue of, among other things, their relationship with the Foundation and facilitationthe public benefit they may enjoy by virtue of FIBK shareholder development withinhaving negotiated the Scott Family, facilitation of communications withinamount received by the Scott Family specificFoundation to stock trading and other policies, stockholder restrictions and regulatory filings, and corporate governance consultation. During 2018, we paid $80 thousand for these services. SFS reimburses us for all salaries, wages, and employee benefits expenses incurred by us on its behalf for personnel.benefit the communities the Company serves.
|
|
| Conflict of Interest Policy |
On an annual basis, each director and executive officer is obligated to complete a director and officer questionnaire that requires disclosure of any transactions with our Company in which the director or executive officer, or any member of his or her immediate family, have a direct or indirect material interest. Under our code of conduct, all employees, including executive officers, are expected to avoid conflicts of interest. Pursuant to our code of ethics for the Chief Executive Officerchief executive officer and senior finance officers, such officers are prohibited from engaging in activities that are or may appear to be a conflict of interest unless a specific, case-by-case exception has first been reviewed and approved by the Board. All of our directors are subject to the Board’s governance standards that include a code of ethics and conduct guide requiring the directors to avoid conflicts of interest.
Information About the Shareholder Meeting |
|
QUESTIONS AND ANSWERS ABOUT THE ANNUAL MEETING AND VOTING |
|
This proxy statement, the accompanying proxy card, and the annual report on Form 10-KAnnual Report are being made available to our shareholders on the Internet at www.astproxyportal.com/ast/40019/beginning on or about March 22, 2019.April 14, 2022. Our Board is soliciting your proxy to vote your shares at the annual meeting of shareholders to be held on May 2, 2019.25, 2022. The Board is soliciting your proxy to give all shareholders the opportunity to vote on matters that will be presented at the annual meeting. This proxy statement provides you with information on these matters to assist you in voting your shares.
We are pleased to take advantage of the SEC e-proxy rules that allow companies to post their proxy materials on the internet. We will be able to provide our shareholders with the information they need while lowering the cost of the delivery of materials and reducing the environmental impact of printing and mailing hard copies. As permitted by the SEC rules, we are sending a Notice of Internet Availability of Proxy Materials, or the Notice, to our shareholders on or about March 22, 2019.April 14, 2022. All shareholders will have the ability to access the proxy materials on the website referred to above and in the Notice. Shareholders will also have the ability to request a printed set of the proxy materials. Instructions on how to access the proxy materials on the internet or to request a printed copy may be found in the Notice. Instructions on how to vote your shares and how to download a proxy card for voting at the annual meeting will also be contained in the Notice.
A proxy is your legal designation of another person to vote on your behalf. By completing and returning the proxy card, you are giving the persons designated in the proxy the authority to vote your shares in the manner you indicate on the proxy card.
Why did I receive more than one Notice or proxy card? |
|
Why did I receive more than one proxy card? |
While we have attempted to consolidate your holdings onto one proxy card, youYou may receive multiple Notices or proxy cards if you hold your shares in different ways (e.g., joint tenancy, trusts, custodial accounts) or in multiple accounts. In addition, if your shares are held by a broker or trustee, you will receive your proxy card or other voting information from your broker or trustee. You should vote separately with respect to each Notice or proxy card you receive as each will have a separate control number and will be related to different shares beneficially owned by you.
|
|
| Who pays the cost of this proxy solicitation? |
We pay the costs of soliciting proxies. Upon request, we will reimburse brokers, banks, trusts, and other nominees for reasonable expenses incurred by them in forwarding proxy materials to beneficial owners of our common stock.
|
|
Is this proxy statement the only way that proxies are being solicited? |
In addition to these proxy materials, certain of our directors, officers and employees may solicit proxies by telephone, facsimile, e-mail, or personal contact. They will not be specifically compensated for doing so.
|
|
| Who is qualified to vote? |
You are qualified to receive notice of and to vote at the annual meeting if you ownedwere an owner of record shares of our Class A or Class B common stock as of the close of business on our record date of March 1, 2019.25, 2022. As of such date, we had only shares of Class A common stock outstanding; all shares of our previously outstanding Class B common stock were converted automatically into shares of Class A common stock before the close of business on the record date.
|
|
| How many shares of common stock may vote at the annual meeting? |
As of the record date, there were 38,281,996109,503,410 shares of Class A common stock outstanding and entitled to vote and 22,394,860 shares of Class B common stock outstanding and entitled to vote at our annual meeting. Our Class A common stock is our only capital stock outstanding and our Class B common stock areis sometimes referred to collectivelyherein as our “common stock.”
How are shares voted by the proxies?
The proxies appointed by the Board will vote your shares as you instruct on your proxy. Each share of Class A common stock is entitled to one vote on each matter to be considered at our annual meeting. If you are the shareholder of record of your shares and each share of Class B common stock is entitled to five votesyou sign a proxy without specific voting instructions indicated, the proxies will vote your shares as recommended by the Board on all matters submitted to a vote of shareholders. Holders of Class A common stock and Class B common stock vote together as a single class on all matters (includingbe considered at the election of directors) submitted to a vote of shareholders, unless otherwise required by law or the Company’s Second Amended and Restated Articles of Incorporation.meeting.
|
|
Is there a quorum requirement? |
For the annual meeting to be valid, there must be a quorum present. A quorum requires that more than 50% of the voting power of our issued and outstanding common stock be represented at the meeting, whether in person or by proxy.
|
|
What is the difference between a “shareholder of record” and other “beneficial” holders? |
These terms describe how your shares are held. If your shares are registered directly in your name, you are a “shareholder of record.” If your shares are held on your behalf in the name of a broker, bank, trust, or other nominee as a custodian, you are a “beneficial” holder. Only shareholders of record may vote at the annual meeting.
If you are a “shareholder of record,” you can vote your shares in person at the annual meeting or by proxy:
via internet at
www.voteproxy.com;
via telephone by calling 1-800-PROXIES in the United States or 1-718-921-8500 in foreign countries;
by mailing in a signed original of the proxy card that will be sent to you by mail or that you may download from the website referred to in the Notice; or
by designating another person to vote your shares with your own form of proxy.
Please refer to the specific instructions set forth on the proxy card. We encourage you to vote electronically or by telephone.electronically. If you are a “beneficial” holder, your broker, bank, trust, or other nominee will provide you with materials and instructions for voting your shares.
|
|
| Can I vote my shares in person at the annual meeting? |
If you are a “shareholder of record,” you may vote your shares in person at the annual meeting. If you are a “beneficial” holder, you must obtain a proxy from your broker, bank, trust, or other nominee giving you the right to vote the shares at the annual meeting.
What is the Board’s recommendation on how I should vote my shares?
|
| | | | |
What isPROPOSAL 1 | The Board recommends you vote your shares FOR the Board’s recommendationelection of each of the five director nominees. |
| PROPOSAL 2 | The Board recommends you vote on how I shouldyour shares FOR ratification of the appointment of each of the three new Directors. |
| PROPOSAL 3 | The Board recommends you vote my shares?your shares FOR ratification of the appointment of RSM US LLP as our independent registered public accounting firm for the year ending December 31, 2022. |
Proposal One - The Board recommends you vote your shares FOR the election of each of the two director nominees.
Proposal Two - The Board recommends you vote your shares FOR ratification of the appointment of RSM US LLP as our independent registered public accounting firm for the year ending December 31, 2019.
Proposal Three - The Board recommends that you vote your shares FOR approval of the charter amendment to provide for majority voting in the election of directors.
Proposal Four - The Board recommends you vote your shares FOR the approval of the adjournment of the annual meeting, if necessary or appropriate, to solicit additional proxies for the foregoing proposals.
Proposal Five - The Board recommends you vote your shares FOR the approval of the compensation of the named executive officers.
|
|
| How will my shares be voted if I do not specify how they should be voted? |
If you are a shareholder of record and you sign and return your proxy card without indicating how you want your shares to be voted, the proxies appointed by the Board will vote your shares FOR the election of twothe five director nominees,nominees; FOR the ratification of the three recently appointed Directors; and FOR the ratification of the appointment of RSM US LLP as our independent registered public accounting firm for the year ending December 31, 2019; FOR approval of the charter amendment to provide for majority voting in the election of directors; FOR the approval of the adjournment of the annual meeting, if necessary or appropriate, to solicit additional proxies for the foregoing proposals; and FOR the approval of the compensation of the named executive officers.2022.
|
|
| Can my broker vote my shares for the proposal regarding the election of directors? |
A broker or other entity holding shares for an owner in street name may vote for routine proposals without receiving voting instructions from the owner under certain circumstances. A broker or other entity may vote on non-routine proposals only if the owner has provided voting instructions. A broker non-vote occurs when the broker or other entity is unable to vote on a proposal because the proposal is non-routine and the owner does not provide any voting instructions, at a meeting where the broker or entity is able to vote on a routine matter as well. The only routine matter in this proxy statement is Proposal TwoThree to ratify the appointment of our independent registered public accounting firm. ProposalsProposal One Three, Four, and Five to elect the director nominees, approveand Proposal Two to ratify the charter amendment, approve the adjournment, if necessary or appropriate, to seek additional votes to approve the foregoing proposals, and approve named executive officer compensation, respectively,appointment of directors are non-routine matters. Therefore, if you are a “beneficial” holder and you do not provide specific voting instructions to your broker or other entity on how to cast your vote in respect of the non-routine matters,matter, the broker or other entity will not be able to cast a vote on your behalf with respect to those matters,that matter, resulting in so-called broker non-votes on all matters without voting instructionsthat matter if the broker or other than Proposal Two.entity votes on the routine matter. It is important that you instruct your broker as to how you wish to have your shares voted on each proposal, even if you wish to vote as recommended by the Board.
|
|
| How are votes withheld, abstentions, and broker non-votes treated? |
Votes withheld in the election of directors and abstentions are deemed as “present”present and entitled“entitled to votevote” at the annual meeting, are counted for purposes of establishing a quorum for the proper conduct of business at the annual meeting, and except for voting on directors, and the amendment to the charter, will have the same effect as a vote against a matter. Abstentions will have no effect on the outcome of the voting on the election of directors or the amendment to the charter. Broker non-votes, if any, are not relevant for general quorum purposes of establishing a quorum for the proper conduct of business at the annual meeting, are not deemed to be “present”present and entitled“entitled to votevote” with respect to any matter for which a broker non-vote is received, and have no effect on the outcome of any of the matters presented at the annual meeting.
|
|
| How do I change or revoke my proxy? |
After voting you may change your vote one or more times, or you may revoke your proxy, at any time before the vote is taken at the annual meeting. You may change your vote or revoke your proxy, as applicable, by doing one of the following:
•sending a written notice of revocation to our corporate secretary that is received prior to the annual meeting, stating that you revoke your proxy;
•signing a later-dated proxy card and submitting it so that it is received prior to the annual meeting in accordance with the instructions included in the proxy card(s);
•voting again via the internet or by telephone using the instructions described in the Notice; or
•attending the annual meeting and voting your shares in person.
With respect to Proposal One to elect the director nominees, the affirmative vote of a pluralitymajority of votesthe voting power of the shares of common stock present in person or represented by proxy at the annual meeting and entitled to vote on the election of directors is neededrequired to elect a director. This means that the two nominees for director who receive the most affirmative votes for their election will be elected. Neither aA “withhold” vote norwill have the same effect as a vote "AGAINST" the director's election. A broker non-vote will neither count as a vote cast “FOR” or "AGAINST" a director nominee ornor have any direct effect on the outcome of the election of directors.
With respect to Proposal Two to ratify the appointment of RSM US LLP as our independent registered public accounting firm for the year ending December 31, 2019, ratification will be approved by the shareholders ifBoard of Directors of three directors, the affirmative vote of a majority of the voting power of the shares of common stock present in person or represented by proxy at the annual meeting and entitled to vote on the matter cast their votes in favorratification of the matter.director appointments is required to ratify each director’s appointment. Abstentions will be treated as a vote cast and will have the same effect as a vote “AGAINST” this proposal. Broker non-votes will not be
counted as a vote cast and will have no direct effect on the outcome of this proposal. A broker non-vote will neither count as a vote cast “FOR” or “AGAINST” the ratification of a director appointment nor have any direct effect on the outcome of the ratification.
ratification vote.
With respect to Proposal Three to approveratify the charter amendment to provide for majority voting in the electionappointment of directors, the amendment will be approved by the shareholders if the votes cast in favor of the matter exceed the votes cast in opposition, Abstentions will be treatedRSM US LLP as a vote cast, but neither abstentions nor broker non-votes will have any effect on the outcome of this proposal.
With respect to Proposal Four to approve an adjournment of the meeting if deemed necessary or appropriate to solicit additional votesour independent registered public accounting firm for the charter amendment or other proposals in this proxy statement,year ending December 31, 2022, the adjournment will be approved by the shareholders ifaffirmative vote of a majority of the voting power of the shares of common stock present in person or represented by proxy at the annual meeting and entitled to vote on this proposal is required to ratify the matter cast their votes in favorappointment of the matter.independent registered public accounting firm. Abstentions will be treated as a vote cast and will have the same effect as a vote “AGAINST” this proposal. BrokerWe are not expecting broker non-votes willon this proposal since this is a routine proposal. Therefore, broker non-votes are not expected to be counted a vote cast and will have no effect onrelevant for determining the outcome of any adjournment.
With respect to Proposal Five to approve the compensation of the names executive officers, we will consider the advisory vote approved by the shareholders if a majority of the voting power of the shares present in person or by proxy and entitled to vote on the matter cast their votes in favor of the matter. Abstentions will be treated as a vote cast and will have the same effect as a vote “AGAINST” this proposal. Broker non-votes will not be counted a vote cast and will have no effect on the outcome of any adjournment vote.
|
|
| Who will count the votes? |
Representatives from American Stock Transfer & Trust Company, LLC will count the votes and serve as our inspector of election. The inspector of election will be appearingattend via telephone at the annual meeting.
|
|
| What if I have further questions? |
If you have any further questions about voting your shares or attending the annual meeting, please contact our corporate secretary, Kirk D. Jensen, at (406) 255-5304,406-255-5304, or e-mail: Kirk.Jensen@fib.com.
|
|
SECTION 16(a) BENEFICIAL OWNERSHIP REPORTING COMPLIANCE |
|
Delinquent Section 16(a) Reports
Section 16(a) of the Exchange Act requires our directors and executive officers, and persons who own more than 10% of our common stock, to file with the SEC initial reports of ownership and reports of changes in ownership of our common stock and other equity securities. Executive officers, directors, and greater than 10% shareholders are required by SEC regulations to furnish us with copies of all Section 16(a) forms they file.
To our knowledge, during the year ended December 31, 2018,2021, all of our directors, executive officers, and greater than 10% shareholders complied with all Section 16(a) filing requirements with the following exceptions: (i) a report with respect to the end of period holdings of Ms. Jodi Delahunt Hubbell was not filed on a timely basis; (ii) a report with respect to five transactions effected by Mr. John M. Heyneman Jr. was not filed on a timely basis; (iii) a report with respect to the end of period holdings of Mr. John M. Heyneman, Jr. was not filed on a timely basis; (iv) a report with respect to six transactions effected by J.S. Investments was not filed on a timely basis; (v) a report with respect to the end of period holdings of Mr. James R. Scott was not filed on a timely basis; (vi) a report with respect to the end of period holdings of Mr. Jonathan R. Scott was not filed on a timely basis; (vii) a report with respect to three transactions effected by Mr. Jonathan R. Scott’s spouse was not filed on a timely basis; (viii) a report with respect to a transaction effected by Mr. Homer Scott, Jr. was not filed on a timely basis.requirements.
The rules of the SEC permit shareholders of a company, after timely notice to the company, to present proposals for shareholder action in the company’s proxy statement where such proposals are consistent with applicable law, pertain to matters appropriate for shareholder action, and are not properly omitted by company action in accordance with the SEC’s proxy rules. Our 20192022 annual meeting of shareholders is expected to be held on or about May 2, 2019,25, 2022, and proxy materials in connection with that meeting are expected to be mailed on or about March 22, 2019.April 14, 2022. The deadline for submission of shareholder proposals pursuant to Rule 14a-8 under the Exchange Act for inclusion in our proxy statement for our 20202023 annual meeting of shareholders is November 15, 2019,December 16, 2022 which is 120 days prior to the anniversary of the mailing date for our proxy materials for this year’s annual meeting.
Additionally, under the terms of our bylaws, shareholders who wish to present an item of business at the 20202023 annual meeting must provide notice to the corporate secretary at our principal executive offices not later than the close of business on the 90th90th day (February 2, 2020)24, 2023), nor earlier than the close of business on the 120th120th day (January 3, 2020)25, 2023), prior to May 2, 2020,25, 2023, which will be the one-year anniversary of our 20192022 annual meeting. If we do not receive notice of a shareholder proposal within that period of time, such proposal will be considered untimely pursuant to Rules 14a-4 and 14a-5(e) and the persons named in proxies solicited by the Board for our 20202023 annual meeting of shareholders may exercise discretionary voting power with respect to such proposal and/or the Chair may consider the matter out of order and not address it at the meeting at all.
We know of no matters other than as contained in the Notice of Annual Meeting of Shareholders to be brought before the meeting. The enclosed proxy, however, gives discretionary authority for the proxy holders to vote on your behalf in the event that any additional matters should be duly presented.
Any shareholder may obtain without charge a copy of our Annual Report, on Form 10-K filed with the SEC for the year ended December 31, 2018, which includes our audited financial statements. Written requests for a copy of our Annual Report on Form 10-K should be addressed to Investor Relations, First Interstate BancSystem, Inc., P.O. Box 30918, Billings, Montana 59116-0918.
BY ORDER OF THE BOARD OF DIRECTORS
Kirk D. Jensen
General Counsel and Corporate Secretary
Billings, Montana
March 15, 2019
April 14, 2022
Appendix A - Non-GAAP Financial Measures
In addition to results presented in accordance with accounting principles generally accepted in the United States of America, or GAAP, this proxy statement contains the following non-GAAP financial measures that management uses to evaluate our capital adequacy and management performance: (i) Adjusted EPS; (ii) Adjusted Efficiency Ratio; (iii) pre-provision net revenue; (iv) tangible book value per share; and (v) return on average tangible common stockholders’ equity. Adjusted EPS and Adjusted Efficiency Ratio are calculated as described in the reconciliation of such financial measures to their most directly comparable GAAP financial measures provided under the caption “Reconciliation of Adjusted EPS and Adjusted Efficiency Ratio” above. Pre-provision net revenue is calculated as net interest income plus non-interest income less non-interest expense. Tangible book value per share is calculated as tangible common stockholders’ equity divided by common shares outstanding. Return on average tangible common stockholders’ equity is calculated as net income available to common shareholders divided by average tangible common stockholders’ equity. These non-GAAP financial measures may not be comparable to similarly titled measures reported by other companies because other companies may not calculate these non-GAAP measures in the same manner. They also should not be considered in isolation or as a substitute for measures prepared in accordance with GAAP.
The Company adjusts the foregoing capital adequacy measures to exclude goodwill and other intangible assets (except mortgage servicing rights). Management believes these non-GAAP financial measures, which are intended to complement the capital ratios defined by banking regulators and to present on a consistent basis our and our acquired companies’ organic continuing operations without regard to the acquisition costs and adjustments that we consider to be unpredictable and dependent on a significant number of factors that are outside our control, are useful to investors in evaluating the Company’s performance because, as a general matter, they either do not represent an actual cash expense and are inconsistent in amount and frequency depending upon the timing and size of our acquisitions (including the size, complexity and/or volume of past acquisitions, which may drive the magnitude of acquisition related costs, but may not be indicative of the size, complexity and/or volume of future acquisitions or related costs), or they cannot be anticipated or estimated in a particular period (in particular as it relates to unexpected recovery amounts). This impacts the ratios that are important to analysts and allows investors to compare certain aspects of the Company’s capitalization to other companies.
We adjusted the performance measures against which our management’s 2021 performance was measured for purposes of determining payouts under the Company’s short-term incentive compensation program. EPS targets were adjusted because at the time the 2021 performance goals were established, the Compensation and Human Capital Committee determined it was not appropriate to reward short term incentives as a result of the provisioning (or recovery) of loan losses, due to indeterminable impact economic recovery might have on the required ACL. We adjusted our Efficiency Ratio for purposes of the short-term incentive program from the FDIC definition of Efficiency Ratio to eliminate OREO expense/income and Investment security gains/losses and non-operating expenses related to a litigation settlement and acquisition related costs. These non-GAAP financial measures have been included in this proxy statement to assist investors and other interested parties in understanding how actual payouts under our short-term incentive plan were determined and how they fit within the Company’s broader executive compensation program.
See the Non-GAAP Financial Measures table below, the information under the caption “Reconciliation of Adjusted EPS and Adjusted Efficiency Ratio” above, and the textual discussion provided elsewhere in this proxy statement for a reconciliation of the above-described non-GAAP Financial Measures to their most directly comparable GAAP financial measures.
.
| | | | | | | | | | | | | | | | | | | | |
| FIRST INTERSTATE BANCSYSTEM, INC. AND SUBSIDIARIES |
| Non-GAAP Financial Measures |
| (Unaudited) |
| | | | | | |
| | For the Year Ended |
| (In millions, except % and per share data) | | Dec 31, 2021 | Dec 31, 2020 | Dec 31, 2019 | Dec 31, 2018 | Dec 31, 2017 |
| | | | | | |
| Net interest income (GAAP) | | $ | 488.2 | | $ | 497.0 | | $ | 495.0 | | $ | 432.5 | | $ | 349.8 | |
| | | | | | |
| | | | | | |
| | | | | | |
| Plus: Non-interest income (GAAP) | | 150.5 | | 156.7 | | 142.6 | | 138.8 | | 137.6 | |
| Total revenue (GAAP) | | 638.7 | | 653.7 | | 637.6 | | 571.3 | | 487.4 | |
| | | | | | |
| | | | | | |
| | | | | | |
| | | | | | |
| | | | | | |
| Less: Non-interest expense (GAAP) | | 405.5 | | 387.5 | | 388.6 | | 356.4 | | 319.7 | |
| Pre-provision net revenue (Non-GAAP) | | 233.2 | | 266.2 | | 249.0 | | 214.9 | | 167.7 | |
| (Reversal of) provision for credit losses (GAAP) | | (14.6) | | 56.9 | | 13.9 | | 8.6 | | 11.0 | |
| Income before tax expense (GAAP) | | $ | 247.8 | | $ | 209.3 | | $ | 235.1 | | $ | 206.3 | | $ | 156.7 | |
| | | | | | |
| | | | | | |
| | | | | | |
| | | | | | |
| | | | | | |
| | | | | | |
| | | | | | |
| | | | | | |
| | | | | | |
| | | | | | |
| | | | | | |
| | | | | | |
| | | | | | |
| | | | | | |
| | | | | | |
| Total common stockholders' equity (GAAP) | (A) | $ | 1,986.6 | | $ | 1,959.8 | | $ | 2,013.9 | | $ | 1,693.9 | | $ | 1,427.6 | |
| Less goodwill and other intangible assets (excluding mortgage servicing rights) | | 690.9 | | 700.8 | | 711.7 | | 631.6 | | 521.8 | |
| Tangible common stockholders' equity (Non-GAAP) | (B) | $ | 1,295.7 | | $ | 1,259.0 | | $ | 1,302.2 | | $ | 1,062.3 | | $ | 905.8 | |
| | | | | | |
| Average common stockholders’ equity (GAAP) | (C) | $ | 1,974.1 | | $ | 1,985.2 | | $ | 1,899.0 | | $ | 1,525.8 | | $ | 1,243.7 | |
| Less: average goodwill and other intangible assets (excluding mortgage servicing rights) | | 695.7 | | 706.1 | | 694.1 | | 566.6 | | 408.9 | |
| Average tangible common stockholders’ equity (Non-GAAP) | (D) | $ | 1,278.4 | | $ | 1,279.1 | | $ | 1,204.9 | | $ | 959.2 | | $ | 834.8 | |
| | | | | | |
| Common shares outstanding | (E) | 62,200,456 | | 62,095,799 | | 65,246,339 | | 60,623,247 | | 56,465,559 | |
| Net income available to common stockholders | (F) | $ | 192.1 | | $ | 161.2 | | $ | 181.0 | | $ | 160.2 | | $ | 106.5 | |
| Book value per share (GAAP) | (A)/(E) | 31.94 | | 31.56 | | 30.87 | | 27.94 | | 25.28 | |
| Tangible book value per share (Non-GAAP) | (B)/(E) | 20.83 | | 20.28 | | 19.96 | | 17.52 | | 16.04 | |
| Return on average common stockholders' equity (GAAP) | (F)/(C) | 9.73 | % | 8.12 | % | 9.53 | % | 10.50 | % | 8.56 | % |
| Return on average tangible common stockholders’ equity (Non-GAAP) | (F)/(D) | 15.03 | | 12.60 | | 15.02 | | 16.70 | | 12.76 | |
| | | | | | |
| | For the Year Ended |
| (In millions, except % and per share data) | | Dec 31, 2016 | Dec 31, 2015 | Dec 31, 2014 | Dec 31, 2013 | Dec 31, 2012 |
| Total common stockholders' equity (GAAP) | (G) | $ | 982.6 | | $ | 950.5 | | $ | 908.9 | | $ | 801.6 | | $ | 751.2 | |
| Less goodwill and other intangible assets (excluding mortgage servicing rights) | | 222.5 | | 215.1 | | 218.9 | | 188.2 | | 189.6 | |
| Tangible common stockholders' equity (Non-GAAP) | (H) | $ | 760.1 | | $ | 735.4 | | $ | 690.0 | | $ | 613.4 | | $ | 561.6 | |
| | | | | | |
| Average common stockholders’ equity (GAAP) | (I) | $ | 963.5 | | $ | 926.1 | | $ | 855.9 | | $ | 779.5 | | $ | 736.0 | |
| Less: average goodwill and other intangible assets (excluding mortgage servicing rights) | | 216.7 | | 216.5 | | 200.7 | | 189.0 | | 190.4 | |
| Average tangible common stockholders’ equity (Non-GAAP) | (J) | $ | 746.8 | | $ | 709.6 | | $ | 655.2 | | $ | 590.5 | | $ | 545.6 | |
| | | | | | |
| Common shares outstanding | (K) | 44,926,176 | | 45,458,255 | | 45,788,415 | | 44,155,063 | | 43,290,323 | |
| Net income available to common stockholders | (L) | $ | 95.7 | | $ | 86.7 | | $ | 84.4 | | $ | 86.1 | | $ | 54.9 | |
| Book value per share (GAAP) | (G)/(K) | 21.87 | | 20.92 | | 19.85 | | 18.15 | | 17.35 | |
| Tangible book value per share (Non-GAAP) | (H)/(K) | 16.92 | | 16.19 | | 15.07 | | 13.89 | | 12.97 | |
| Return on average common stockholders' equity (GAAP) | (L)/(I) | 9.93 | % | 9.37 | % | 9.86 | % | 11.05 | % | 7.46 | % |
| Return on average tangible common stockholders’ equity (Non-GAAP) | (L)/(J) | 12.81 | | 12.23 | | 12.88 | | 14.59 | | 10.07 | |